With the Flow Ohio – Watershed Report for the Week of Nov 29-Dec 4
By Gillian Ward
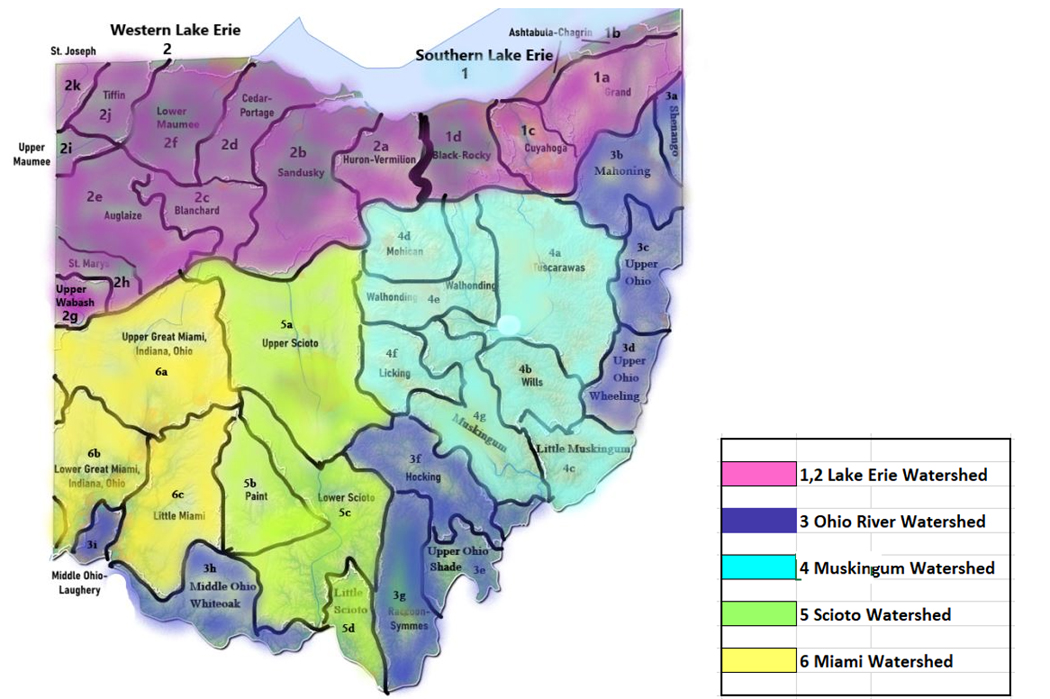
With the Flow Ohio tracks trends in your watershed, posting weekly updates from USGS WaterWatch Current Streamflow and Ohio EPA Division of Drinking and Ground Waters.
USGS WaterWatch Current Streamflow – data is captured from real time monitoring stations, including the percentage of normal (mean) flow, flow volume in cubic feet per second, and flow depth. A river or stream that has reached action stage for flood preparation will be highlighted. This report contains USGS Current Stream Flows: as at Nov 24, 2021
USGS Groundwater Watch – data captured from well sites, including depth (in feet) from ground surface to reach water level; the higher measurement represents lower groundwater level.
Public Drinking Water systems will be added each week - active (A) community (C) systems sourced from groundwater or surface water for residential delivery, by watershed, noting recent violations and enforcement orders, lead and copper test results as posted in Ohio EPA Drinking Water Watch. For more information, see report key at the end of this document.
EPA Lead and Copper Rule
USA Environmental Protection Agency upholds and enforces drinking water for public water systems through the Safe Water Act. Lead can enter the drinking water stream when corrosion occurs in certain types of distribution lines and connections Lead is toxic when consumed and accumulates in the body over time. The effects of lead toxicity may present as stomach upset to brain damage.
WTOH tracks lead and copper test results by watershed, as published by EPA Ohio on their Drinking Water Watch database.
Public Water systems sample and test for lead and copper at customer taps periodically through the year. While there is no safe level of lead in drinking water, and the maximum non-enforceable target for drinking water is set to 0, the EPA requires action steps be taken when more than 10% of customers are found to have 15 parts per billion lead at their taps, or 0.015 mg/l.
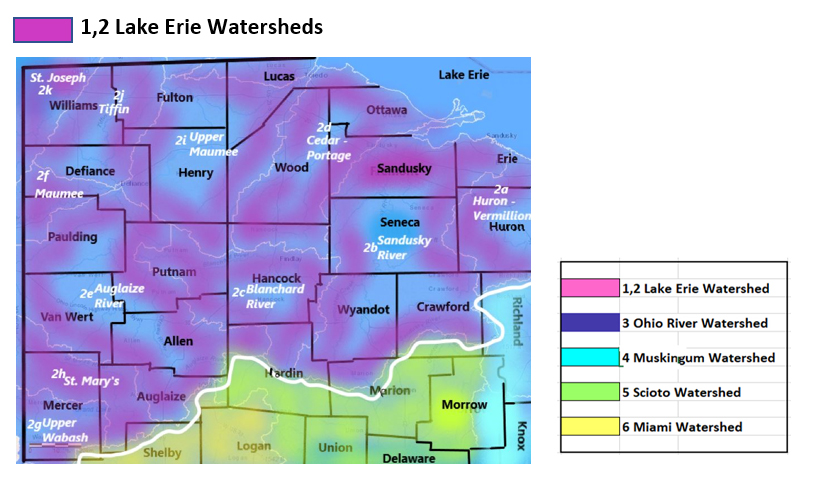
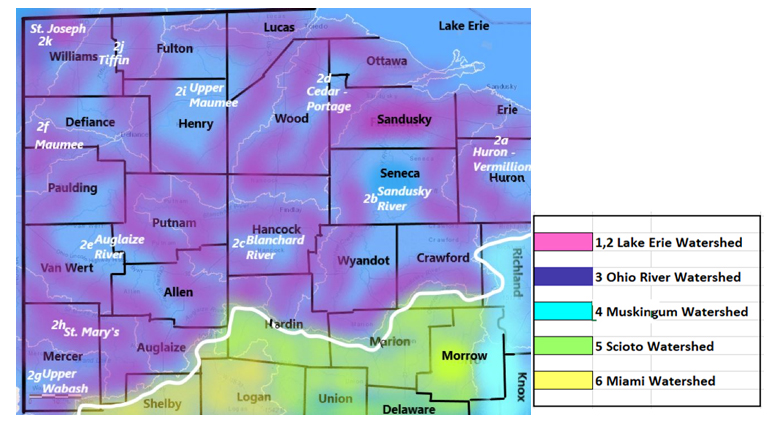
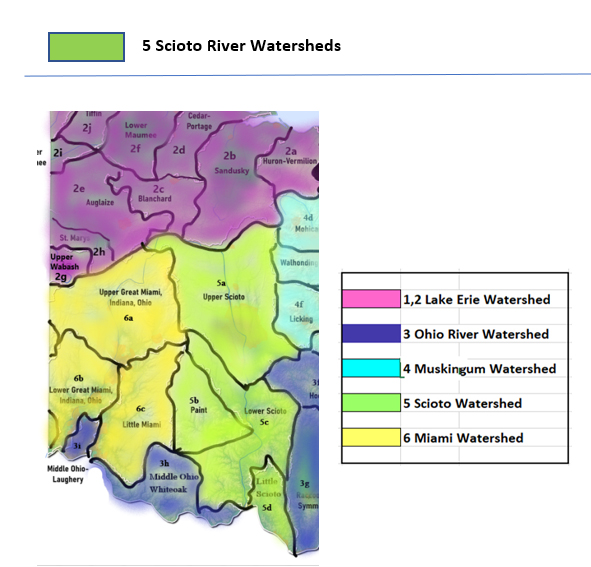
1,2 Lake Erie Watersheds
1 Southern Lake Erie
1a Grand River Watershed
Flows: parts of Ashtabula, Lake, Geauga, Portage, Trumbull Counties (flow data updated Nov 24, 2021)
- Conneaut Creek drains an area of 175 sq miles in Ashtabula County; at Conneaut station, the flow is rated “normal”; 55% above mean flow rate at 198 cfs. Depth of flow is just over 2ft.
- Grand River drains 685 sq miles in Lake County; the flow near Painesville is “normal”, 87% above mean at 950 cfs and 3.3 ft deep. Minor flood stage at this station is 12.5 ft. The water temperature has dropped in half again this week to 2.9°C
Groundwater Monitor Geauga County
USGS 412331081123000 GE-22 Groundwater monitoring station in Geauga County reporting 13.22 feet depth to water level, feet below land surface (updated Nov 24, 2021)
1b Ashtabula River - Chagrin River Watershed
Flows: parts of Ashtabula, Lake, Cuyahoga, Geauga, Portage Counties
- Chagrin River drains an area of 246 sq miles of Lake County into Lake Erie. Flow is normal at Willoughby station, 74% above mean and discharging 275 cfs. The gage height (flow depth) is 3.71 ft.
- Unnamed tributary to Chagrin River drains 7.69 sq miles of Cuyahoga County. The flow at Pepper Pike is 3.77 cfs and 6 ft deep.
1c Cuyahoga River Watershed
Flows: parts of Cuyahoga, Summit, Portage, Geauga Counties
- Cuyahoga River drains an area of 788 sq miles in Ohio. With its headwaters in Geauga County, it takes a loop south into Portage and then hooks back north through Summit, passing through Cuyahoga County to discharge into Lake Erie. At Hiram Rapids, the nearest monitoring station to the headwaters in Geauga County, the flow is normal, 122% above mean at 270 cfs and 2.5 ft deep; at Old Portage, 106% above mean at 405 cfs and 3.45 feet deep; at Jaite station normal, 85% above mean at 537 cfs and 3.25 ft deep; at Independence station, flowing normal, 81% above mean at 616 cfs; at the Newburgh Heights station nearest the outlet in Cuyahoga County flow is normal, 63% above mean at 708 cfs; water temperature is 6.8°
- West Creek drains an area of 9.23 sq miles in Cuyahoga County. The flow at Pleasant Valley Rd (headwaters) station is 5% above mean and .7 cfs; At Ridgewood Road, Parma is flowing normal, 30% above mean at 1.3 cfs and 5 ft deep; at Brooklyn Heights (nearest to the outlet) flowing normal, 46% above mean at 5.5 cfs and 1.2 ft deep.
- Mill Creek gathers runoff and drains 12.9 sq miles in the Cuyahoga River watershed; the flow is monitored at Garfield Heights 16 % above mean and 2.8 cfs and 1.4 ft deep.
- East Branch Big Creek collects flow from 19.2 sq miles in Cuyahoga County. The flow at Brooklyn is 34% above mean at 9.36 cfs and 2.24 ft deep.
- Brandywine Creek near Macedonia monitoring data is temporarily unavailable.
- Tinkers Creek drains an area of 83.9 sq miles of Cuyahoga County, flow at Bedford is registering LOW this week, 34% above mean flow at 43 cfs and 2.5 ft deep.
1d Black River - Rocky River Watershed
Flows: parts of Lorain, Ashland, Huron, Cuyahoga Counties
- Rocky River drains an area of 267 sq miles into Lake Erie. Flow at Berea is rated normal, 49% above mean flow, 108 cfs and 5.3 ft deep. The water temp has plunged this week, from 11 down to 2.3°
- Plum Creek near Olmstead drains 15.7 sq miles in Cuyahoga County, flowing 125% above mean, 10.6 cfs and 1.9 ft deep.
- Black River drains an area of 396 sq miles of Lorain County into Lake Erie. Flow at Elyria is normal this week, 41% above mean flow, 97 cfs and 1.44 ft deep. The water is 3.5°
Public Drinking Water Systems:
- Aqua Ohio – Ashtabula (OH0400711) Ashtabula County; surface water source drawn from Lake Erie; serving 13233 residential customers
- Conneaut (OH0400411): Ashtabula County; surface water source, drawn from Lake Erie; serving 5635 residential customers
- Aqua Ohio – Mentor (OH4301511) Lake County; surface water sourced from Mentor Lake, serves 74,500 residents through 31689 service connections
- Fairport Harbor Village (OH4300411) Lake County; surface water sourced from Lake Erie, serves 3180 residents through 1491 service connections
- Lake County East (OH4302911) Lake County; surface water sourced from Lake Erie serving 40,656 residents through 11773 service connections
- Lake County West (OH4302411) Lake County; surface water sourced from Lake Erie serving 78379 residents through 29867 service connections
- Painsville City (OH4302611) Lake County; surface water sourced from Lake Erie serving 31728 residents through 11329 service connections
Ravenna City (OH6703211) Portage County; surface water source serving 16000 residents through 5540 service connections (no major violations or enforcements since 2000)
- Berea City (OH1800111) Cuyahoga County; active community system drawing from east branch of Rocky Creek, Baldwin Creek and Coe Lake; serving 19000 residential customers through 6985 service connections
- Cleveland Public Water System (OH1801212) Cuyahoga County, surface water drawn from Baldwin, Crown, Morgan and Nottingham Creeks; serving 1,308.955 residents through 453075 connections
- Avon Lake City (OH4700311) Lorain County; surface water
- Elyria (OH4700411) Lorain County; surface water
- Lorain City (OH47007911) Lorain County; surface water
- Oberlin (OH4700911), Lorain County, surface water
- Wellington Village (OH4701511), Lorain County, surface water
2 Western Lake Erie Watersheds
Flow information updated November 24, 2021
2a Huron River/Vermillion River
Flows: parts of Erie, Huron, Lorain Counties
- Vermillion River drains an area of 262 sq miles of Lorain County into Lake Erie just east of Sandusky Bay. Flow at the Vermillion monitoring station is 56% above mean flow at 79 cfs and 2.4 ft deep. The water temperature has dropped this week to 1.4°C.
- Huron River drains an area of 371 sq miles of Huron County into Lake Erie east of Sandusky Bay. Flow at the Milan station is 74% above mean flow at 132 cfs and 6.7 ft deep. The water is 1.4°C.
- Old Woman Creek drains 22.1 sq miles in Erie County. At Berlin Rd near Huron, the flow is normal, 35% above mean at 2.1 cfs, 1.9 ft deep.
2b Sandusky River Watershed
Flows: parts of Sandusky, Seneca, Wyandot, Crawford (4 Main) also parts of Erie, Ottawa, Wood, Huron, Hancock, Hardin, Marion, and Richland counties
- Sandusky River drains an area of 1251 sq miles in Crawford and Wyandot Counties. The flow near Bucyrus in Crawford County is unavailable; at Fremont, 59% above mean flow at 399 cfs and 1.55 ft deep. The water is 4 °C.
- Honey Creek drains an area of 149 sq miles of Seneca County into Sandusky River. The flow at Melmore in Seneca County is normal, 26% above mean at 28cfs and 2.31 ft deep.
- Rock Creek drains an area of 34.6 sq miles in Seneca County into Sandusky River. The flow at Republic is 5% above mean at .37 cfs and 3.9 ft deep; at Tiffin the flow is 29% above mean at 5.41 cfs and 3.68 ft deep
- Tymochtee Creek drains an area of 229 sq miles in Wyandot County into Sandusky River. The flow at Crawford is 29% above mean at 43.2 cfs and 2.27 ft deep
2c Blanchard River Watershed
Flows: parts of Hardin, Hancock, Putnam, Seneca, Allen, Wyandot Counties
- Blanchard River drains 756 sq miles of Hancock and Putnam Counties into Auglaize River and on to Lake Erie. The flow measured nearest the headwaters below Mt. Blanchard is 16% above mean at 19.5 cfs and 3 ft deep; the flow above Findlay is 7% above mean at 17.5 cfs and 5.7 ft deep; at Findlay 25% above mean, 46.9 cfs and 1.05 ft deep. The water is 6.7° C; at Gilboa 16% above mean at 83.6 cfs and 4.43 ft deep; at Ottawa in Putnam County is 22% above mean at 119 cfs and 6 ft deep; near Dupont is 70% above mean at 178 cfs and 6.4 ft deep
2d Cedar River-Portage River Watershed
Flows: parts of Hancock, Wood, Seneca, Sandusky, Ottawa Counties
- Portage River drains an area of 494 sq miles of at Sandusky County. The flow at Woodville is 56% above mean, 156 cfs and 2.72 ft deep. The water is 3.9°C; near Elmore the flow is 35% above mean at 164 cfs and 2.63 ft deep
2e Auglaize River Watershed
Flows: parts of Defiance, Fulton, Henry, Lucas, Paulding, Williams, Wood Counties
- Auglaize River drains an area of 2318 sq miles into Maumee River, where it empties into the western part of Lake Erie. The flow station closest to headwaters is at Kossuth in Allen County. Flow here is 59% above mean at 66.7 cfs; flow at Fort Jennings is low, 10% above mean at 19.2 cfs and 1.94 ft deep; flow at Defiance is normal, 56% above mean, 762 cfs and 6.42 ft deep. monitoring station is “normal” 183% above mean, 429 cfs and 6.08 ft deep.
- Little Flat Rock Creek drains an area of 15.2 sq miles in Paulding County into Auglaize River. The flow near Junction is 20% above mean, 1.28 cfs and 2.3 ft deep
- Little Auglaize River drains an area of 401 sq miles in Paulding County into Auglaize River. The flow at Melrose is 181% above mean at 113 cfs and 13.42 ft deep
2f - Lower Maumee River Watershed
Flows: parts of Defiance, Fulton, Henry, Lucas, Paulding, Williams, Wood Counties
- The entire Maumee River drains an area of 6330 sq miles of Ohio State. The lower portion flow at Waterville is normal, 100% above mean, 2440 cfs and 3 ft deep
- Ottawa River drains an area of 350 sq miles in Lucas County directly into western Lake Erie. The flow near University of Toledo at Toledo is much above normal 68 % above mean, 97 cfs and 3.53 ft deep.
2g Upper Wabash River Watershed
Flows: parts of Mercer, Darke Counties
The headwaters of the Wabash River are in Ohio, however, USGS does not monitor flows on this system in the state of Ohio. Spills and weather incidents in this area will be noted as they occur, the residue flows west out of state.
2h St. Mary’s River Watershed
Flows: Mercer, Van Wert
- Mary’s River drains an area of 386 sq miles in Mercer and Van Wert Counties. From the headwaters in Mercer County, St. Mary’s flows west into Indiana into the Maumee River, which crosses back into Ohio and empties into Lake Erie. The flow at Rockford is 36% above mean, 110 cfs and 2.75 ft deep; the flow at Walcot Street at Willshire is 20% above mean, 132 cfs and 3.17 ft deep.
2i Upper Maumee River Watershed
Flows: parts of Paulding and Defiance Counties
- The upper Maumee River drains an area of 2129 sq miles of Paulding County. The flow at Antwerp is 98% above mean at 1150 cfs and 8 ft deep; near Defiance 66% above mean at 2350 cfs and 2.38 ft deep;
- Platter Creek drains an area of 19.5 sq miles of Defiance County into Maumee River. The flow at Sherwood is 70% above mean at 5.31 cfs
2j Tiffin River
Flows: parts of Williams, Defiance Counties
- Tiffin River starts drains an area of sq miles in Williams and Defiance Counties. Tiffin flows south and gathers in runoff from Defiance County before joining the Maumee River. The flow monitoring station nearest the headwaters is located at Stryker in Williams County: normal, 99% above mean, 272 cfs and 5.93 ft deep; near Evansport is 69% above mean, 344 cfs and 12.13 ft deep.
2k St. Joseph River
Flows: Williams, Defiance, Lucas
- Joseph River drains an area of 610 sq miles in Defiance County. The flow at Newville is 104% above mean, 476 cfs and 6.24 ft deep.
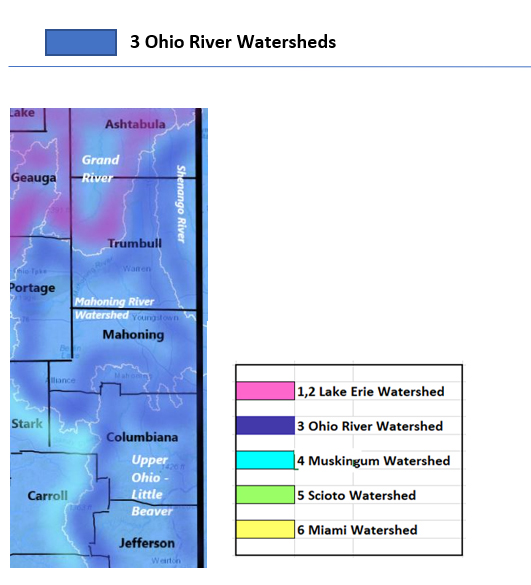
3 Ohio River Tributaries
3a Shenango River Watershed
Flows: parts of Ashtabula, Trumbull, Mahoning
- Pymatuning Creek drains an area of 96.7 sq miles in Trumbull County to the Shenango River across the state line into Pennsylvania. Shenango River flows through Pennsylvania to the Ohio River, there are no monitoring stations for Shenango River in Ohio State. The flow at Kinsman in Trumbull County is 6.93 ft deep, 1.8°C; 74% above mean, 117 cfs and 4.79 ft deep; at Sharpsville is normal, 114% above mean, 982 cfs and 3.60 ft deep. The water is 5.1° Flow information updated on 2021-11-24.
- Eagle Creek drains an area of 97.6 sq miles in Trumbull County, exiting the state before joining Shenango River. The flow at Phalanx Station in Trumbull County is normal, 55% above normal at 57 cfs and 5.34 ft deep
Public Drinking Water Systems
- Andover Village (OH0400012) Ashtabula County; Wells 0002, 0003, 0004, 0007, 0M01, 0005, 0008; serves 1250 residential customers through 534 service connections
- - Andover Camplands (OH0400012) Ashtabula County; well 004, N01, W01 Campground serves 409 residents year round; serves 5600 from April 1 to Oct 31 through 4175 connections; 2021 violations - reporting - consumer confidence rule; 2021 lead, copper test results - 0 mg/l lead, .0106 mg/l copper
- - Whispering Willow (OH04011212) Ashtabula County; Groundwater source - well 0001, 0002 Mobile home park serves 217 through 102 connections; 2021 violations – none; 2021 lead, copper test results – n/a
- Concord Care Centre of Cortland (OH7800712) Trumbull County; Groundwater source – well 0001, institution serving 50 residents and 45 transient clients through a single service connection; violation Nov 2020 under the Public Notice Rule; 2021 lead, copper tests – 0 mg/l lead, .093 mg/l copper
- Lead level .003 mg/l in 2021; .008 in 2020
3b Mahoning River
Flows: parts of Stark, Mahoning, Trumbull
- Mahoning River drains an area of 978 sq miles in portions of Stark and Trumbull Counties as it flows west to east, exiting the state via Trumbull County and joining Shenango River before reaching the Ohio River. The flow at Alliance, nearest the headwaters in Stark County is not rated, 3.72 ft deep and 2.4°C; below Berlin Dam near Berlin Centre is 10% above mean at 30.1 cfs and 1.58 ft deep, 6.0°C; at Princetown in Mahoning County is 89% above mean at 230 cfs and 2.61 ft deep, 5.2°C; at Leavittsburg in Trumbull County is normal, 60% above mean, 397 cfs and 3.32 ft deep, 5.3°C; below West Ave at Youngstown is normal, 53% above mean, 544 cfs and 1.79ft deep, 5.4° Flow information updated on 2021-11-24.
- Mosquito Creek drains an area of 97.5 sq miles in Trumbull County before joining the Mahoning River south of Warren City. The flow measured closest the headwaters is near Greene Centre, 130% above mean at 22.8 cfs, 5.5 ft deep and 2.6°C; the flow below Mosquito Creek Dam near Cortland is 29% over mean at 20.3 cfs and 1.27 ft deep and 4.6°C
Public Drinking Water Systems
- Newton Falls City (OH7802311) Trumbull County; surface water source Mahoning River; serves 6300 residents through 2547 connections; no violations in 2021; 2021 lead, copper test results – 0mg/l lead; .098 mg/l copper
- Warren City (OH7803811) Trumbull County; surface water source, Mosquito Reservoir, serves 54900 residents through 22500 connections; 2021 violations - state monitoring and reporting violation for microcystins, resolved Sept 21
3c Little Beaver Watershed
Flows: parts of Jefferson, Carroll, Columbiana, Harrison
- Little Beaver River drains an area of 496 sq miles of Columbiana County into the Ohio River. The flow at East Liverpool is normal, 53% above mean flow, 192 cfs and 3 ft deep.
- Yellow Creek drains an area of 147 sq miles in Jefferson County. Flow is “normal” at Hammondsville, 55% above mean flow at 60 cfs and 1.63 ft deep. Flow information updated on 2021-11-24.
- Short Creek drains an area of 123 sq miles in Jefferson County. Flow is “normal” at Dillonvale station, 60% above mean flow at 55.4 cfs, 2.25ft deep. Flow information updated on 2021-11-24.
3d Wheeling Creek Watershed
Flows: parts of Belmont, Monroe Counties
- Wheeling Creek drains an area of 97sq miles in Belmont County. Flow is normal below Blaine, 50% above mean flow at 49.2 cfs and 1.30 ft deep. Flow information updated on 2021-11-24.
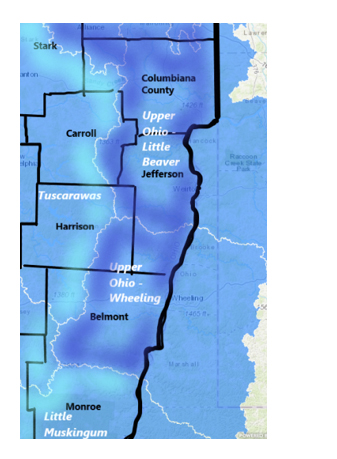
3e Shade River Watershed
Flows: parts of Meigs County
- Shade River at drains an area of 156 sq miles in Meigs County. The monitoring station located at Chester shows normal flow, 34% above mean, 43.6 cfs and 5ft deep. The water temperature at this location is registering 4.2°C. Flow information updated on 2021-11-24.
3f Hocking River Watershed
Flows: parts of Athens, Hocking, Fairfield Counties
- Hocking River drains an area of 943 sq miles in Hocking County; the station at Enterprise in Hocking reports normal flow, 64% above mean at 202 cfs and 1.14 ft deep; the flow is normal at Athens, registering 55% above mean flow, 354 cfs and 3.61ft deep. Flow information updated on 2021-11-24.
- Clear Creek drains an area of 89 sq miles in Hocking County, joining Hocking River; the station near Rockbridge in Hocking County reports normal flow, 48% above mean, 37 cfs, a little more than a foot deep. Flow information updated on 2021-11-24.
3g Raccoon Creek – Symmes Creek Watershed
Flows: parts of Hocking, Athens, Meigs, Vinton, Jackson, Gallia Counties
- Raccoon Creek drains an area of 585 sq miles in Gallia County. The monitoring station at Adamsville shows the river flowing normal, 65% above mean flow at 236 cfs and 3.30ft deep. Flow information updated on 2021-11-24.
- Symmes Creek drains 302 sq miles of Lawrence County into the Ohio River; at Aid, the flow is normal, 42% above mean at 93cfs and 6.54 ft deep. Flow information updated on 2021-11-24.
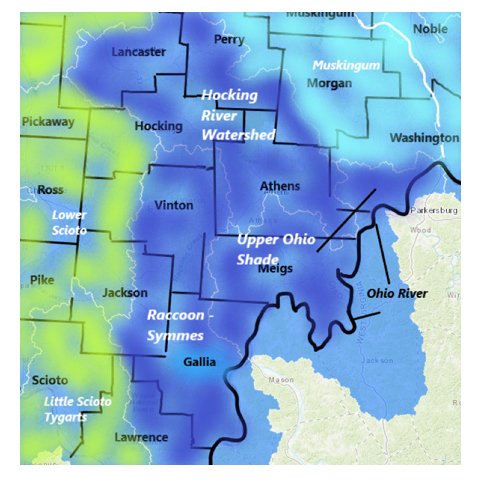
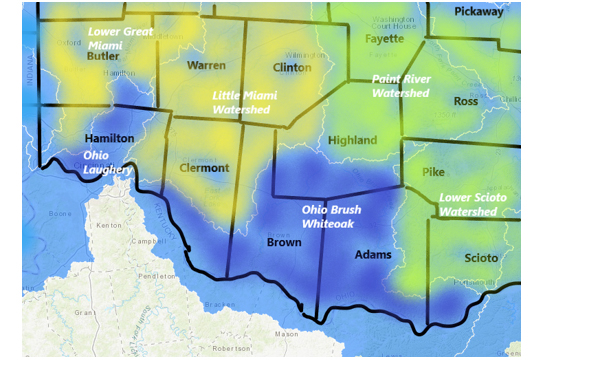
3h Middle Ohio – White Oak Watershed
Flows: parts of Brown County
- White Oak Creek drains an area of 208 sq miles in Brown County; the flow above Georgetown is 113% above mean, 81.5cfs and 4.5 ft deep. Flow information updated on 2021-11-24.
3i Middle Ohio – Laughery Watershed
- No flow monitoring stations reporting on Ohio state side for this watershed
- 
4 Muskingum River Watersheds
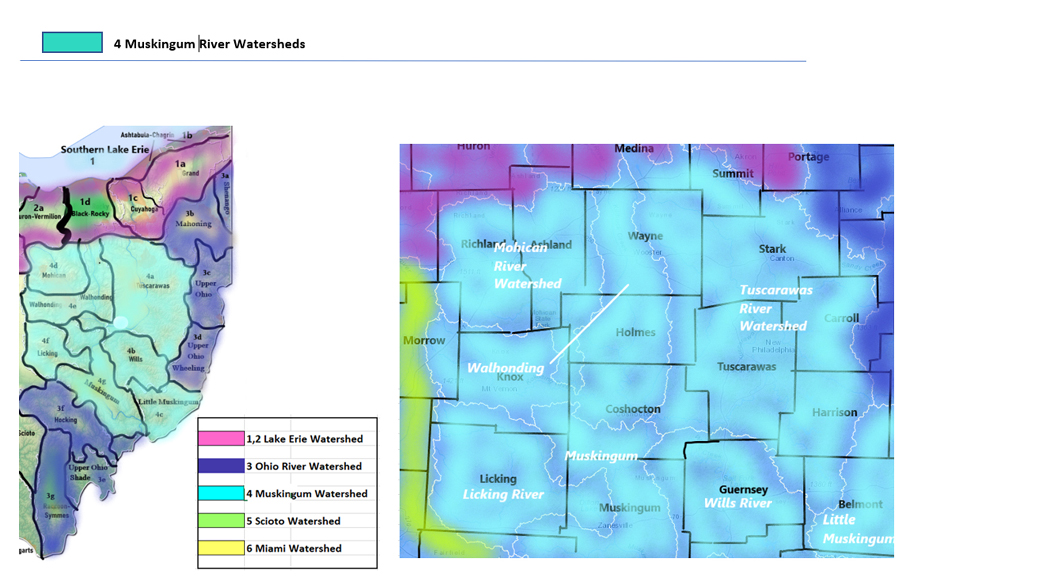
4a Tuscarawas River Watershed
Flows: parts of Tuscarawas County
- Tuscarawas River drains an area of 2443 sq miles of Tuscarawas County. The flow at Newcomerstown is normal, 84% above mean at 1780cfs and 2 ft deep. Flow information updated on 2021-11-24.
4b Wills Creek Watershed
Flows: parts of Licking, Guernsey, Tuscarawas Counties
- Wills Creek drains an area of 406 sq miles in Guernsey County. The flow at Cambridge is normal, 104% above mean at 458 cfs and 4 ft deep; at Derwent flow is 6.81 ft deep. Flow information updated on 2021-11-24.
4c Little Muskingum River Watershed
Flows: parts of Washington, Noble, Monroe, Guernsey
- Little Muskingum River drains an area of 210 sq miles of Washington County; at Bloomfield is flowing in the normal range at 40% above mean, 38 cfs and 4 ft deep. Flow information updated on 2021-11-24.
4d Mohican River Watershed
Flows: parts of Richland County
- Clear Fork Mohican River drains an area of 115 sq miles in Richland County. The streamflow gauge at Bellville reports flow of 2 ft deep; no volume data available. Flow information updated on 2021-11-24.
- Black Fork Mohican River drains an area of 28 sq miles in Richland County. The flow at Shelby is 62% above mean at 23cfs and 6.30ft deep; unranked. Flow information updated on 2021-11-24.
4e Walhonding River Watershed
Flows: parts of Knox, Morrow, Ashland, Richland, Coshocton, Holmes Counties
- Walhonding River drains an area of 1505 sq miles in Coshocton County. The flow below Randle is 1.22 ft deep; the flow below Mohawk Dam at Nellie is 6.33 ft deep. Flow information updated on 2021-11-24.
- Kokosing River drains an area of 202 sq miles in Knox County. At Mount Vernon station in Knox County, the Kokosing is flowing normal, 42% above mean flow at 86 cfs and 2.71 ft deep. Flow information updated on 2021-11-24.
- Killbuck Creek drains an area of 464 sq miles in Holmes County. The flow at Killbuck in Holmes County is normal, 39% above mean flow at 108 cfs and 7 ft deep. Flow information updated on 2021-11-24.
4f Licking River Watershed
Flows: parts of Licking County
- Licking River drains an area of 537 sq miles of Licking County. The flow monitor at Newark is normal, 80% above mean flow at 470 cfs and 4 ft deep. Flow information updated on 2021-11-24.
- North Fork Licking River drains an area of 241 sq miles of Licking County; at Utica in Licking County is flowing normal, 21% above mean at 46cfs, 7.77 ft deep; at Ohio Street in Newark the flow is 0.44 feet deep. The flow is not otherwise rated at this time. Flow information updated on 2021-11-24.
- South Fork Licking River drains an area of 133 sq miles of Licking County. The station near Hebron reports normal flows, 112% above mean flow at 26 cfs and 3.82 ft deep. Flow information updated on 2021-11-24.
- 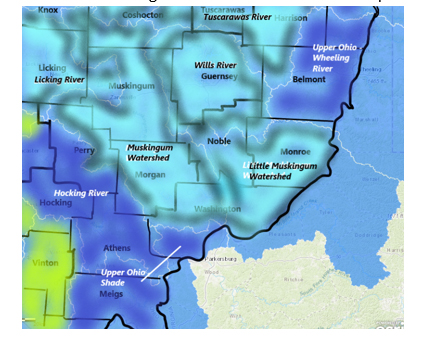
4g Muskingum River Watershed
Flows: Morgan, Washington, Noble, Muskingum, Coshocton Counties
- Muskingum River drains an area of 7947 sq miles. At Coshocton in Coshocton County the Upper Muskingum is flowing normal, 74% at 2870cfs and 7.05 ft deep; At Dresden in Muskingum County is flowing normal, 79% above mean at 3760 cfs and 8 ft deep; At McConnelsville in Morgan County, the river is flowing normal, 86% above mean at 4830 cfs and 3.40ft deep. Flow information updated on 2021-11-24.
- Muskingum River (lower) at Beverly station in Washington County is 63% above mean at 5200 cfs and 16.37 ft deep. Flow information updated on 2021-11-24.
5 Scioto River Watersheds
5a Upper Scioto Watershed
Flows: parts of Madison, Union, Franklin, Pickaway, Champaign, Logan, Marion, Delaware, Morrow, Crawford, Licking, Knox, Fairfield Counties
- The Upper Scioto River drains an area of 980 sq miles in Marion and Delaware Counties. The flow at La Rue in Marion County is normal, 21% above mean at 39cfs, 1.9ft deep; the flow at Prospect in Delaware County is normal, 42% above mean at 145 cfs and 2ft deep, water temp is 4.6C; the flow below O’Shaughnessy Dam near Dublin is normal, 38% above mean at 226 cfs, 4.12 ft deep; at Columbus in Franklin County is normal, 47% above mean flow at 542 cfs and 6.28 ft deep; near Commercial Point in Pickaway County the flow is 63% above mean at 1690 cfs and 10.46 ft deep. Flow information updated on 2021-11-24.
- Darby Creek drains an area of 534 sq miles in Pickaway County. The streamflow gauge at Darbyville shows normal, flowing at 82% above mean at 267cfs and 3ft deep. Flow information updated on 2021-11-24.
- Alum Creek drains an area of 122 sq miles in Delaware County. The flow at Africa is above normal, 97% above mean at 123 cfs and 2.13 feet deep; 8.2C. Flow information updated on 2021-11-24.
- Upper Olentangy River drains an area of 157 sq miles in Marion County, 393 sq miles by the time it reaches Delaware. The flow at Claridon in Marion County is 2.24 ft deep; the flow at Delaware in Delaware County is normal, 44% above mean at 172 cfs and 2.29 ft deep; near Worthington is normal, 40% above the mean, 241 cfs and 2.28 ft deep. Flow information updated on 2021-11-24.
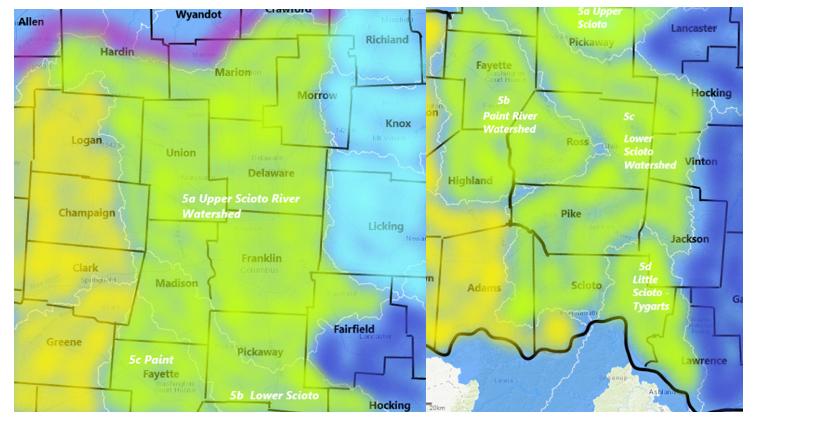
5b Paint Creek Watershed
Flows: parts of Clinton County
- Paint Creek drains an area of 249 sq miles in Clinton County. The flow near Greenfield is above normal, 96% above the mean, 170 cfs and 2.36 ft deep. Flow information updated on 2021-11-24.
5c Lower Scioto Watershed
Flows: Parts of Madison, Highland, Franklin counties
- Scioto River (lower) drains an area of 5836 sq miles from its headwaters in Marion County down to its outlet at the Ohio River. The lower end flow at Higby in Ross County is normal, 92% above mean flow at 3030 cfs and 3 ft deep; the flow at Piketon in Pike County is normal, 63 % above mean, 3230 cfs, and 3.37 ft deep. Flow information updated on 2021-11-24.
- Deer Creek drains an area of 228 sq miles in Madison County. The flow at Mount Sterling is above normal, 76% above mean at 179 cfs and 4.56 ft deep. Flow information updated on 2021-11-24.
- Rocky Fork Creek drains an area of 140 sq miles in Highland County. The flow is normal, 95% above mean, 117cfs and 2.61 ft deep. Flow information updated on 2021-11-26.
- Big Walnut Creek drains an area of 544 sq miles. The flow at Rees in Franklin County is normal, 164% at 331cfs and 3ft deep. Central College is normal, 68% above the mean, 99 cfs, and 3.34ft deep. Flow information updated on 2021-11-24.
- Walnut Creek drains an area of 274 sq miles. The flow at Ashville is 47% above the mean, 111 cfs and 5.15 ft deep. Flow information updated on 2021-11-24.
5d Little Scioto Watershed
Flows are not monitored in Ohio State
6 Miami River Watersheds - flow
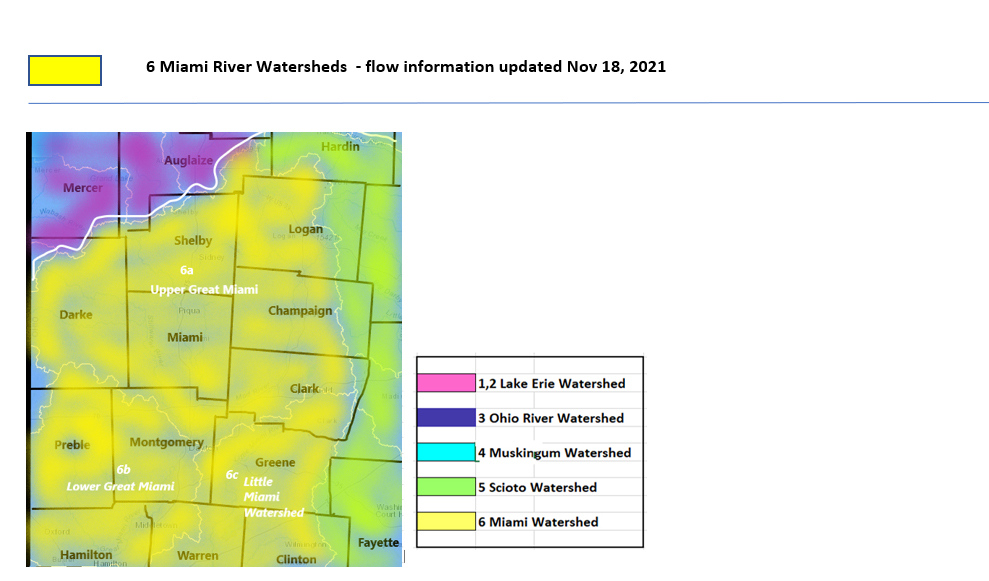
6a Upper Great Miami Watershed
- The Great Miami River (Upper) drains an area of 1149 sq miles in Hardin, Logan, Shelby, Miami and Darke and Montgomery Counties. The flow monitoring station closest to the head of the river is at Sidney, in Shelby County. The flow at Sidney is normal, 66% above mean at 229 cfs and 1.58 ft deep;; at Troy is normal, 50% above the mean, 346 cfs and 2.52 ft deep; The flow at Taylorsville is normal, 80% above mean at 549 cfs and 2.54 ft deep
- Loramie Creek drains an area of 257 sq miles in Shelby County. The flow near Newport is normal, 50% above mean, 53.8 cfs and 3.7 ft deep; at Lockington in Shelby County is normal, 32% above the mean, 44.3 cfs and .85 ft deep.
- Bokengehalas Creek drains an area of 40.4 sq miles of Logan County. The station at de Graff is reporting normal, 51% above mean flow at 22 cfs and 1.39 ft deep.
- Mad River (Upper) drains an area of sq miles in Logan County. The station at West Liberty is normal, 64% above mean, 31.3 cfs and 2.5 feet deep.
- Little Miami River drains an area of 1203 sq miles in Clark and Greene Counties. The flow at Milford is normal, 52% above the mean, 402 cfs, and 5.28 ft deep.
- (Upper) Mad River drains an area of 635 sq miles in Logan and Champaign Counties. The flow near Dayton is normal, 57% above the mean, 322 cfs and 2.60 ft deep; the flow near Urbana is above normal, 127% above mean at 145 cfs and 3.1 ft deep; at St. Paris Pike near Eagle City in Clark County is flowing normal, 99% above mean at 263 cfs and 6.4 ft deep;
- Stillwater Creek drains an area of 503 sq miles in Warren County. The flow at Pleasant Hill is above normal, 118% above the mean, 217 cfs and 1.88 ft deep. The water is 11C.
- Greenville Creek drains an area of 193 sq miles in Warren and Darke Counties. The flow near Bradford is above normal, 114% above the mean, 140 cfs and 2 ft deep.
6b Lower Great Miami Watersheds
- Great Miami River drains an area of 3838 sq miles in Ohio, with the lower portion taking runoff from sq miles in Hamilton and Butler Counties. The flow at Miamitown is 1.95 ft deep, no flow info available; at Dayton flow is normal, 71% above mean at 1390 cfs and 25 ft deep; at Miamisburg, Montgomery County flow is normal, 84% above mean at 1680 cfs and 4.65
- Lower Mad River drains an area of 310 sq miles in Clark, Southeast and Champaign counties. The flow at Dayton is normal, 68% above mean, 411 cfs and 2.8 ft; St. Paris Pike is normal, 77% above the mean, 175 cfs and 6.16 ft deep,
- Beaver Creek drains an area of 113 sq miles in Greene County. The flow near Celina is 330% above the mean, 58 cfs, and 5.3 ft deep.
- Wolf Creek drains an area of 68.7 sq miles in Montgomery County into the Great Miami River. The flow at Dayton is normal, 92% above mean flow at 33.3 cfs and 1.5 ft deep
6c Little Miami Watershed
- Little Miami River drains an area of 1204 sq miles sq miles in Hamilton, Warren, Clinton and Clermont Counties. The flow at Oldtown is normal, 110% above mean at 94 cfs and 1.9 ft deep.
At Perintown is normal, 62% above the mean, 209 cfs and 2.82 ft deep; the flow at Milford in Clermont is normal, 114% over mean, 987 cfs and 6 ft deep, flow near Spring Valley is 3 ft deep
- East Fork Little Miami River drains an area of 476 sq miles in Clermont County. Flow at Williamsburg is normal, 42% above mean at 115 cfs and 1.5 ft deep; below Harsha Dam near Bantam in Clermont County is 16 ft deep, water temperature is 11.6C, the flow at Perintown is 122% above mean at 540 cfs
- Massies Creek drains an area of 63.2 sq miles in Greene County into the Little Miami River. The flow at Wilberforce is above normal at 125% above mean at 60.8 cfs and 2.73 ft deep
- Caesar Creek drains an area of 239 sq miles in Green County into the Little Miami River. The flow at Wellman is 7 ft deep.
- O’Bannon Creek drains an area of 54 sq miles in Clermont County. The flow at Loveland is above normal, 167% above mean flow, 72.4 cfs and 1.5 ft deep; this system has been up to 8 ft deep at peak in 2021.
![]()
Report Key
Ohio EPA Drinking Water Watch
Public Drinking Water Source SW – Surface Water is drawn from lake, reservoir, creek or river; GW – Ground water is drawn from a well
Violations and Enforcement Actions are shown for the current year
Lead and Copper Test results are shown for the current year if available
Water systems are classified according to rules developed by the U.S. Environmental Protection Agency (EPA) and each state. Water Systems fall into two broad categories: public and non-public.
Public water systems are classified as one of the following:
|
C – Community
|
Serves at least 15 service connections used by year-round residents or regularly serves 25 year-round residents.
|
|
NTNC – Non-Transient Non-Community
|
Serves at least the same 25 non-residential individuals during 6 months of the year.
|
|
NC – Transient Non-Community
|
Regularly serves at least 25 non-residential individuals (transient) during 60 or more days per year.
|
This classification is based on information in each of the following five areas:
|
1.
|
Quantity and type of population served (e.g., transient, residential).
|
|
2.
|
Number of days served (or annual operating period (i.e., the period(s) of the year that the water system is in operation)).
|
|
3.
|
Number of service connections (i.e., the number of connections for each service area such as commercial, agricultural, residential).
|
|
4.
|
Activity status of the water system (i.e., active, or inactive).
|
|
5.
|
Sources of water (e.g., reservoir, well. Sources of water may be active or inactive depending on whether the source is seasonal or year-round. The current date determines active or inactive status).
|
|
|
|
|
|
|
Bottom of Form


