With the Flow Ohio – Watershed Report for the Week of February 7 to 13, 2022 -
By Gillian Ward
With the Flow Ohio tracks trends in your watershed, posting weekly updates from USGS WaterWatch Current Streamflow and Ohio EPA Division of Drinking and Ground Waters.
USGS WaterWatch Current Streamflow weekly report data is captured from real-time monitoring stations, including the flow volume as a percentage of average (mean), flow volume in cubic feet per second, flow depth and temperature, where available. A river or stream that has reached flood action stage is shown in bold text, a system in flood stage appears in red, ice affected in italics.
USGS Groundwater Watch – data captured from well sites, including depth (in feet) from ground surface to reach water level; the higher measurement represents lower groundwater level.
Public Drinking Water systems are added to our database each week - active (A) community (C) systems sourced from groundwater or surface water for residential delivery, by watershed. Recent violations and enforcement orders, lead and copper test results as posted in Ohio EPA Drinking Water Watch are included. For more information, see report key at the end of this document.
EPA Lead and Copper Rule
USA Environmental Protection Agency upholds and enforces drinking water for public water systems through the Safe Water Act. Lead can enter the drinking water stream when corrosion occurs in certain types of distribution lines and connections Lead is toxic when consumed and accumulates in the body over time. The effects of lead toxicity may present as stomach upset to brain damage.
WTOH tracks lead and copper test results by watershed, as published by EPA Ohio on their Drinking Water Watch database.
Public Water systems sample and test for lead and copper at customer taps periodically through the year. While there is no safe level of lead in drinking water, and the maximum non-enforceable target for drinking water is set to 0, the EPA requires action steps be taken when more than 10% of customers are found to have 15 parts per billion lead at their taps, or 0.015 mg/l. Action level for copper is 1.3 mg/l.
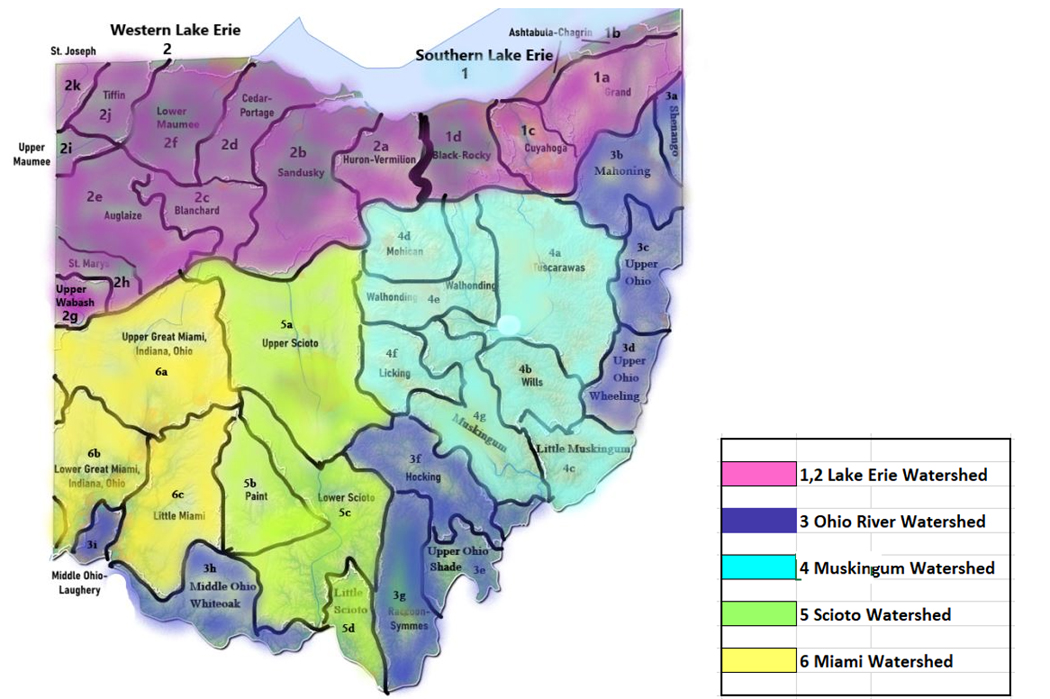
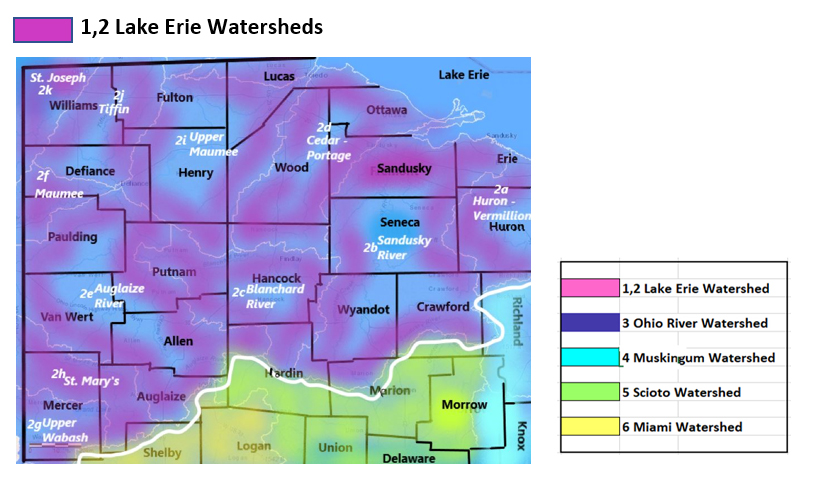
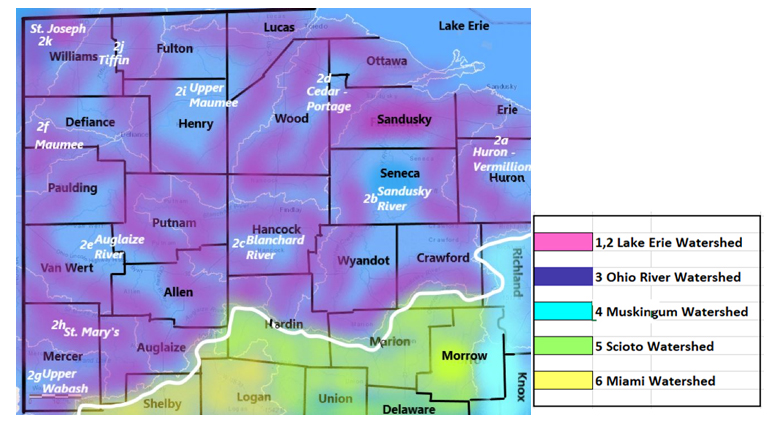
1,2 Lake Erie Watersheds
1 Southern Lake Erie Watersheds
1a Grand River Watershed
Flows: capturing rainfall and snowmelt from parts of Ashtabula, Lake, Geauga, Portage, Trumbull Counties
- Grand River drains 685 sq miles in Lake County; the flow near Painesville is normal, 164.9% above mean at 2430 cfs and 2.88 ft deep (flood stage 12.5 ft), .2°C and 490 µS/cm (02-07-22)
Groundwater Monitor Geauga County – stable trend, slight increase this week
USGS 412331081123000 GE-22 Groundwater monitoring station in Geauga County reporting 12.54 feet depth to water level, feet below land surface (updated 02-06-2022)
1b Ashtabula River - Chagrin River Watershed
Flows: catching parts of Ashtabula, Lake, Cuyahoga, Geauga, Portage Counties
- Conneaut Creek drains an area of 175 sq miles in Ashtabula County; at Conneaut station, the flow is ice affected, 4.26 ft; -.2°C (updated 02-07-22)
- Chagrin River drains an area of 246 sq miles of Lake County into Lake Erie. Flow is normal at Willoughby station, ice affected. The gage height (flow depth) is 6.90 ft (flood stage 12 ft) (updated 02-07-22)
- Unnamed tributary to Chagrin River drains 7.69 sq miles of Cuyahoga County. The flow at Mayfield Village is ice affected, 1.09 ft deep; The flow at Pepper Pike is ice affected, 6.17 ft deep (updated 02-07-22)
- Euclid Creek drains an area of 5.13 sq miles in Cuyahoga County. The flow at South Euclid is ice affected,.68 ft deep; the flow at Cleveland is ice affected,05 ft deep (updated 02-07-22)
- East Branch at Euclid Creek drains 7.11 sq miles in Cuyahoga County. The flow at Richmond Heights is ice affected, 1.51 ft deep (updated 02-07-22)
1c Cuyahoga River Watershed
Flows: parts of Cuyahoga, Summit, Portage, Geauga Counties
- Cuyahoga River drains an area of 788 sq miles in Ohio. With its headwaters in Geauga County, Cuyahoga takes a loop south into Portage and then hooks back north through Summit, passing through Cuyahoga County to discharge into Lake Erie. At Hiram Rapids, the nearest monitoring station to the headwaters in Geauga County, the flow is below normal: 78.8% above mean at 255 cfs and 2.46 ft deep (flood stage 7ft); at Old Portage, 91.2% above mean at 539 cfs and 3.87 feet deep (flood at 10.5ft); at Jaite station normal, 61.75% above mean at 772 cfs and 3.8 ft deep, 7.4°C; at Independence station, flowing normal, 95.3% above mean at 1030 cfs and 4.47 ft deep, (flood at 17 ft), 0.6°C and 1470 µS/cm; at the Newburgh Heights station nearest the outlet in Cuyahoga County flow is not rated: 60% above mean at 1160 cfs; 1.9° (updated 02-07-22)
- Indian Creek drains an area of 4.49 sq miles in Cuyahoga County. The flow at Macedonia is ice affected, 1.3 ft deep (flood stage 9.5ft) (updated 02-07-22)
- West Creek drains an area of 9.23 sq miles in Cuyahoga County. The flow at Pleasant Valley Rd near Parma is 29.9% above mean at 1.67 cfs and 9.23 ft deep (8.85 ft is the minimum operating limit); at Ridgewood Road, Parma is unrated, flowing 35.3% above mean at 4.18 cfs and 4.86 ft deep (flood stage 10ft); at Brooklyn Heights (nearest to the outlet) flowing normal: 5% above mean at 7.7 cfs and 1.3 ft deep. (updated 02-07-22)
- Mill Creek gathers runoff and drains 12.9 sq miles in the Cuyahoga River watershed; the flow is monitored at Garfield Heights 35% above mean and 21.2 cfs and 1.12 ft deep; at Garfield Parkway flow is 9.6% above mean at 10.6 cfs and 1.61 ft deep (flood stage 7.5 ft) (updated 02-07-22)
- Big Creek drains an area of 35.3 sq miles in Cuyahoga County. The flow at Cleveland is not ranked, 6% above mean at 45 cfs and 2.75 ft deep. (updated 02-07-22)
- East Branch Big Creek collects flow from 19.2 sq miles in Cuyahoga County. The flow at Brooklyn is 5% above mean at 4.69 cfs and 2.2 ft deep. (updated 02-07-22)
- Brandywine Creek drains an area of 16.4 sq miles in Summit County. The flow near Macedonia is unrated, 2.94 ft deep, (flood stage is 13 ft). (updated 02-07-22)
- Tinkers Creek drains an area of 83.9 sq miles of Cuyahoga County, flow at Bedford is ice affected, 2.9 ft deep (flood at 9.5 ft). (updated 02-07-22)
- Chippewa Creek drains an area of 17.5 sq miles in Cuyahoga County before joining the Cuyahoga River. The flow near Brecksville is normal, 28% above mean at 17.9 cfs and 2.85 ft deep (updated 02-07-22)
- Doan Brook drains an area of 8.2 sq miles in Cuyahoga County. The flow at MLK Jr. Dr Cleveland is unrated, 8.27 cfs and 1.95 ft deep. (updated 02-07-22)
USGS does not list groundwater monitors in Cuyahoga County.
1d Black River - Rocky River Watershed
Flows: runs off parts of Lorain, Ashland, Huron, Cuyahoga Counties
- Black River drains an area of 396 sq miles of Lorain County into Lake Erie. Flow at Elyria is above normal this week, 121.1% above mean flow, 557 cfs and 3.25 ft deep. The water is 0.0° Specific conductance 489 µS/cm (flow information updated 02-07-22)
- Rocky River drains an area of 267 sq miles of Cuyahoga County into Lake Erie. Flow at Berea is experiencing equipment malfunction, (flood stage 14 ft) The water temp .1° (updated 02-07-22)
- Plum Creek drains 15.7 sq miles in Cuyahoga County. The flow near Olmstead Falls is 39.2% above mean, 37.7 cfs and 2.61 ft deep (flood at 8ft). (updated 02-07-22)
- Abram Creek drains an area of 8.12 sq miles in Cuyahoga County. The flow at Brook Park is not rated, 25.5% above mean at 8.15 cfs and .65 ft deep (min operating limit .19ft) (updated 02-07-22)
- Baldwin Creek drains an area of 8.9 sq miles in Cuyahoga County. The flow at Strongsville is normal, 49.1% above mean at 13.5 cfs and 2.77 ft deep. (updated 02-07-22)
USGS Groundwater Watch
Ashland County
Station ‘70700 Name:AS-2 OH
Most Recent Measurement: 24 ft Measurement Date:10/28/2021
Station: ‘3000 Name:AS-3 OH
Most Recent Measurement:12.94 ft Measurement Date:10/28/2021
Periodic Measurement of these wells means that we will not have new measurements to report every week, we will continue to monitor the USGS site for updates and post accordingly.
2 Western Lake Erie Watersheds
2a Huron River/Vermillion River
Flows: parts of Erie, Huron, Lorain Counties
- Vermillion River drains an area of 262 sq miles of Lorain County into Lake Erie just east of Sandusky Bay. Flow at the Vermillion monitoring station is ice affected, 8.59 ft deep (flood stage 9ft); -0.1°C; 53 µS/cm (updated 02-07-22) Note: Even though ice affected, this system is flowing at 4x the gage depth measured last week; watch for dangerous conditions on the ice.
- Huron River drains an area of 371 sq miles of Huron County into Lake Erie east of Sandusky Bay. Flow at the Milan station is flowing much above normal, 427.3% above mean at 2000 cfs and 11.2 ft deep, up from last week’s 6.95 ft deep (flood stage is 18 ft). The water is 0°C; 549 µS/cm (updated 02-07-22)
- Old Woman Creek drains 22.1 sq miles in Erie County. At Berlin Rd near Huron, the flow is normal, 65.4% above mean at 29.2 cfs, 2.62 ft deep.
(updated 02-07-22)
USGS Groundwater Watch for Erie County – increasing
Site ‘3900 E10-OH measures 53.68 on 02-06-22, up from 55.54 on 01-31-22
(Highest water level on record: 2.23 ft, June 2011; Lowest water level on record: 65.23ft Jan 2017)
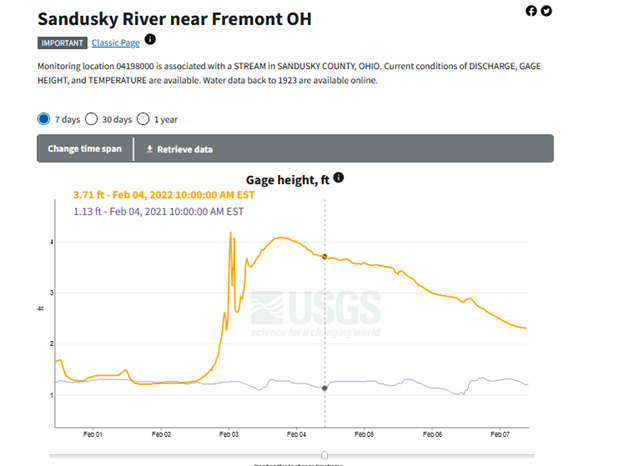
2b Sandusky River Watershed
Flows: parts of Sandusky, Seneca, Wyandot, Crawford (4 Main) also parts of Erie, Ottawa, Wood, Huron, Hancock, Hardin, Marion, and Richland counties
- Sandusky River drains an area of 1251 sq miles in Crawford and Wyandot Counties. The flow near Bucyrus in Crawford County is normal, 41.6% above mean at 48.1 cfs and 1.21 ft deep (floods at 8.5 ft); near Upper Sandusky above normal flow, 154% above mean at 641 cfs and 3.03 ft deep (flood at 13 ft); normal flow at Fremont, 69.4% above mean flow at 1250 cfs and 2.3 ft deep (floods at 10ft); .5 °C. (02-07-22)
- As of 10 am EST Feb 7, see below graph from USGS WaterWatch showing the flow depth compared with this time last year:
- Honey Creek drains an area of 149 sq miles of Seneca County into the Sandusky River. The flow at Melmore in Seneca County is normal, 35.4% above mean at 88.9 cfs and 2.83 ft deep. (02-07-22)
- Rock Creek drains an area of 34.6 sq miles in Seneca County into the Sandusky River. The flow at Republic is unrated 3.26% above mean at 1.65 cfs and 4.22 ft deep; at Tiffin, the flow is unrated, showing erroneous high values today. The provisional nature of streamflow data means that extreme readings must be checked, and if found to be in error, are canceled from the record. Chief Hydrologist Harris confirmed that the Rock Creek at Tiffin values is ice affected and erroneous. (flow at 4340.1% above mean at 2450 cfs up from 7.11 cfs and 9.71 feet deep up from 3.71 last week will be removed from the data set) (updated 02-07-22)
- Tymochtee Creek drains an area of 229 sq miles in Wyandot County into Sandusky River. The flow at Crawford is above normal, 65.4% above mean at 247 cfs and 3.18 ft deep (flood stage 8.5 ft). (updated 02-07-22)
USGS Groundwater Watch
Crawford County Station ’3100 CR-1-OH 20.16 ft as at 10-28-2021
Hardin County Station ‘2600 HA-2A-OH 7.86 ft as at 01-31-2022
(these sites are on periodic measurements; the records will be updated here as new measurements are posted on USGS Groundwater Watch.)
2c Blanchard River Watershed
Flows: drains parts of Hardin, Hancock, Putnam, Seneca, Allen, Wyandot Counties
- Blanchard River drains 756 sq miles of Hancock and Putnam Counties into Auglaize River and on to Lake Erie. The flow measured nearest the headwaters below Mt. Blanchard is 19.4% above mean at 130 cfs and 4.16 ft deep (flood at 14 ft); the flow above Findlay is 16% above mean at 136 cfs and 6.23 ft deep; near Findlay is normal, 52.25% above mean, 209 cfs and 1.58 ft deep (flood stage 12 ft), 2.4° C; at Gilboa in Putnam County is 83% above mean at 589 cfs and 6.29 ft deep; at Ottawa in Putnam County is 65% above mean at 558 cfs and 9.27 ft deep; near Dupont is 105.8% above mean at 708 cfs and 9.45 ft deep (updated 02-07-22)
- Lye Creek drains an area of 18.8 sq miles. The flow above Findlay is 6.62% above mean at 4.49 cfs and 1.29 ft deep (flood stage is 6ft). (02-07-22)
- Eagle Creek drains an area of 51 sq miles in Hancock County. The flow above Findlay is 11.6% above mean at 22 cfs and 3.24 ft deep (flood stage is 9ft) .4°C and 681 µ/cm. (updated 02-07-22)
- Riley Creek drains an area of 70.3 sq miles in Putnam County. The flow below Pandora is not rated, 19% above mean, 19.1 cfs and 3.41 ft deep. (updated 02-07-22)
2d Cedar River-Portage River Watershed
Flows: catches parts of Hancock, Wood, Seneca, Sandusky, Ottawa Counties
- Portage River drains an area of 494 sq miles of at Sandusky County. The flow at Woodville is normal, 38.95% above mean, 180 cfs and 3.06 ft deep. The water is 0°C; near Elmore the flow is unrated, 2.8% above mean at 28.6 cfs and 1.94 ft deep (flood stage 12 ft) (updated 02-07-22)
2e Auglaize River Watershed
Flows: washes parts of Defiance, Fulton, Henry, Lucas, Paulding, Williams, Wood Counties
- Auglaize River drains an area of 2318 sq miles into Maumee River, where it empties into the western part of Lake Erie. The flow station closest to headwaters is at Kossuth in Allen County. Flow here is 88.1% above mean at 523 cfs and 7.04 ft deep; flow at Fort Jennings is much above normal, 287.4 above mean at 1310 cfs and 7.04 ft deep (provisional data, this may be an error) (flood stage 13ft); flow near Dupont is 15.31 ft deep; flow near Defiance is normal 82.5% above mean, 2240 cfs and 7.65 ft deep (flood stage 21 ft) (updated 02-07-22)
- Little Flat Rock Creek drains an area of 15.2 sq miles in Paulding County into Auglaize River. The flow near Junction is 44% above mean, 2.49 cfs and 2.44 ft deep. (updated 02-07-22)
- Little Auglaize River drains an area of 401 sq miles in Paulding County into Auglaize River. The flow at Melrose is 74.6% above mean at 220 cfs and 13.91 ft deep. (updated 02-07-22)
2f - Lower Maumee River Watershed
Flows: streams from parts of Defiance, Fulton, Henry, Lucas, Paulding, Williams, Wood Counties
- The entire Maumee River drains an area of 6330 sq miles of Ohio State. The lower portion flow at Waterville is recorded at normal, 72.6% above mean, 4970 cfs and 3.86 ft deep, .3°C and 880 µ/cm. (updated 02-07-22) Ice is affecting the sensors here, throwing out erroneous elevated flow readings, the Chief Hydrologist waded in this river, confirming it is not 4970 cfs. Check back to see the correction to the provisional streamflow data.
- Ottawa River drains an area of 350 sq miles in Lucas County directly into western Lake Erie. The flow near Lima is 40.2% above mean, 64.2 cfs and 11.4 ft deep; at Kalida is normal, 30.85% above mean at 268 cfs and 5.41 ft deep (flood stage 19 ft); the University of Toledo at Toledo is below normal 10.6% above mean, 14.4 cfs and 2.66 ft deep (flood stage 14.5 ft) (update 02-07-22)
- Wolf Creek drains an area of 24.8 sq miles in Lucas County. The flow at Holland is much above normal, 69.6% above mean at 26.1 cfs and 2.2 ft deep (flood stage 13 ft). (updated 02-07-22)
2g Upper Wabash River Watershed
Flows: from parts of Mercer, Darke Counties
The headwaters of the Wabash River are in Ohio, however, USGS does not monitor flows on this system in the state of Ohio. Spills and weather incidents in this area will be noted as they occur, the residue flows west out of state.
2h St. Mary’s River Watershed
Flows: from Mercer, Van Wert
- Mary’s River drains an area of 386 sq miles in Mercer and Van Wert Counties. From the headwaters in Mercer County, St. Mary’s flows west into Indiana into the Maumee River, which crosses back into Ohio and empties into Lake Erie. The flow at Rockford is 43.8% above mean, 397 cfs and 5.9 ft deep (flood stage 13 ft); the flow at Walcot Street at Willshire is ice affected, 5.36 ft deep. (updated 02-07-22)
2i Upper Maumee River Watershed
Flows: parts of Paulding and Defiance Counties
- The upper Maumee River drains an area of 2129 sq miles of Paulding County. The flow at Antwerp in Paulding County is 77.8% above mean at 1750 cfs and 8.99 ft deep, (temp and conductivity gage malfunctioning); near Defiance flow is normal, 53.8% above mean at 3430 cfs and 2.76 ft deep (flood at 14 ft), .2°C (updated 02-07-22)
- Platter Creek drains an area of 19.5 sq miles of Defiance County into Maumee River. The flow at Sherwood is 0% above mean at 0 cfs and .89 ft deep. (updated 02-07-22)
2j Tiffin River
Flows: wetting parts of Williams, Defiance Counties
- Tiffin River starts drains an area of sq miles in Williams and Defiance Counties. Tiffin flows south and gathers in runoff from Defiance County before joining the Maumee River. The flow monitoring station nearest the headwaters is located at Stryker in Williams County: normal, 34.75% above mean, 151 cfs and 4.74 ft deep (flood stage 11ft); near Evansport is 27.1% above mean, 178 cfs and 11.21 ft deep. (updated 02-07-22)
- Bean Creek drains an area of 206 sq miles in Fulton County. The flow at Powers is 97.2% above mean at 239 cfs and 9.55 ft deep. (updated 02-07-22)
- Unnamed tributary to Lost Creek drains an area of 4.23 sq miles in Defiance County. The flow near Farmer is normal, 35.55% above normal, 1.71 cfs and 1.44 ft deep. (updated 02-07-22)
2k St. Joseph River
Flows: Williams, Defiance, Lucas
- Joseph River drains an area of 610 sq miles in Defiance County. The flow at Newville is 39.2% above mean, 257 cfs and 5.43 ft deep (flood stage 12 ft) (updated 02-07-22)
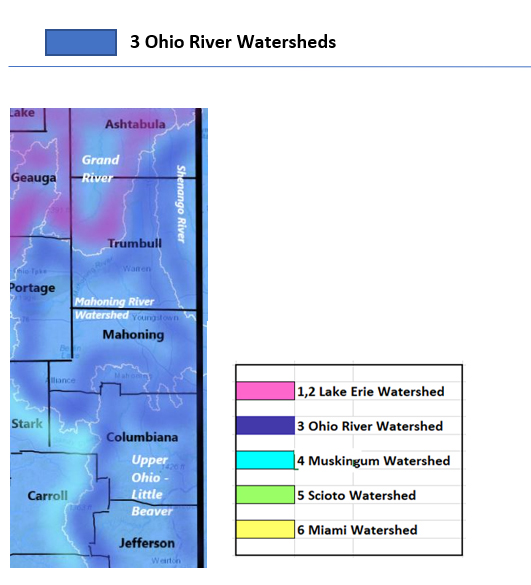
3 Ohio River Tributaries
3a Shenango River Watershed
The paddle-popular Shenango River system originates in Pennsylvania’s Shenango Valley. The river flows in and out of northeast Ohio, winding its way through west PA on its way down to meet the Ohio River. “The Shenango River Watchers is a 501(c)(3) non-profit watershed group formed to restore and protect the environmental, scenic, and recreational attributes of the Shenango River Watershed”, mission statement of the award-winning group that organizes clean-up events and an annual Thanksgiving Day 5k Gobble Wobble, taking off from Hermitage, PA. The group has information resources for paddlers on their website www.shenangoriverwatchers.org.
Flows: caught from parts of Ashtabula, Trumbull, Mahoning
USGS does not have river monitors placed on the Shenango River on the Ohio side of the border, but the following systems flowing into the Shenango River are monitored:
- Pymatuning Creek drains an area of 96.7 sq miles in Trumbull County to join the Shenango River across the state line in Pennsylvania. The flow at Kinsman in Trumbull County is 7.81 ft deep, 0°C (02-07-22)
- On the Pennsylvania side of the border, the Shenango River at Pymatuning Dam is flowing normal, 37.8% above mean, 115 cfs and 4.78 ft deep; at Sharpsville is normal, 77.8% above mean, 887 cfs and 3.5 ft deep(flood stage 6.8ft). The water is 1.0° Flow information updated on (02-07-22).
3b Mahoning River
Flows: draining parts of Stark, Mahoning, Trumbull
- Mahoning River drains an area of 978 sq miles in portions of Stark and Trumbull Counties as it flows west to east, exiting the state via Trumbull County and joining Shenango River before reaching the Ohio River. The flow at Alliance, nearest the headwaters in Stark County, is not rated, ice affected, 03 ft deep, -.3°C; below Berlin Dam near Berlin Centre is 235.3% above mean at 576 cfs and 3.01 ft deep (flood stage 5.4ft), 1.7°C; at Pricetown in Mahoning County is above normal, 171.5% above mean at 571 cfs and 3.62 ft deep (flood stage 8.1ft), 2.9°C; The flow at Leavittsburg is above normal, 151.9% above mean, 1280 cfs and 5.47 ft deep (flood stage 12.5), .4°C; below West Ave at Youngstown is normal, 104.1% above mean, 1750 cfs and 3.26 ft deep (flood stage 14ft) 1ºC and 535 µS/cm; at Lowellville, the flow is 102.75 % above mean at 1930 cfs and 4.17 ft deep and 1.5°C, 584 µS/cm. (02-07-22)
- West Branch Mahoning River drains an area of 82 sq miles in Portage County. The flow near Ravenna is 92 cfs, water temp .6ºC; the flow at Wayland is normal, 228% above mean at 156 cfs and 4.38 ft deep. (updated 02-07-22)
- Mosquito Creek drains an area of 97.5 sq miles in Trumbull County before joining the Mahoning River south of Warren City. The flow measured closest the headwaters is near Greene Centre, 39.9% above mean at 45.5 cfs, 5.82 ft deep and -.1°C; the flow below Mosquito Creek Dam near Cortland is 172.8% over mean at 175 cfs and 2.16 ft deep and 3° Flow information updated on 02-07-22.
- Eagle Creek drains an area of 97.6 sq miles in Trumbull County, exiting the state before joining Shenango River. The flow at Phalanx Station in Trumbull County is above normal, 97.55% above normal at 154 cfs and 5.97 ft deep. (updated 02-07-22)
3c Little Beaver Watershed
Flows: catching parts of Jefferson, Carroll, Columbiana, Harrison
- Little Beaver River drains an area of 496 sq miles of Columbiana County into the Ohio River. The flow at East Liverpool is ice affected, 5.41 ft deep. (02-01-22)
- Yellow Creek drains an area of 147 sq miles in Jefferson County. Flow is unrated at Amsterdam is 1.3 ft deep; the flow is ice affected at Hammondsville, 2.45 ft deep. (02-07-22)
- Short Creek drains an area of 123 sq miles in Jefferson County. Flow is normal at Dillonvale station, 66.2% above mean flow at 123 cfs, 2.97 ft deep (Flood Stage 9ft). (02-07-22)
3d Wheeling Creek Watershed
Flows: catching parts of Belmont, Monroe Counties
- Wheeling Creek drains an area of 97sq miles in Belmont County. Flow is above normal below Blaine, 108.2% above mean flow at 174 cfs and 2.02 ft deep (Flood stage 6ft). (02-07-22)
3e Shade River Watershed
Flows: parts of Meigs County
- Shade River at drains an area of 156 sq miles in Meigs County. The monitoring station located near Chester is registering normal flow, 92.35% above mean at 348 cfs and 7.15 ft deep (flood stage 17ft deep). 8°C (02-07-22)
3f Hocking River Watershed
Flows: contains parts of Athens, Hocking, Fairfield Counties
- Hocking River drains an area of 943 sq miles in Hocking County; the station at Enterprise in Hocking reports normal flow, 70.4% above mean at 607 cfs and 2.57 ft deep (flood stage 20ft); the flow is above normal at Athens, registering 127.7% above mean flow, 2240 cfs and 7.48 ft deep (flood stage 20ft). (02-07-22)
- Clear Creek drains an area of 89 sq miles in Hocking County, joining Hocking River; the station near Rockbridge in Hocking County reports normal flow, 55.3% above mean, 80.6 cfs, and 1.47 ft deep. (02-07-22)
3g Raccoon Creek – Symmes Creek Watershed
Flows: rolling over parts of Hocking, Athens, Meigs, Vinton, Jackson, Gallia Counties
- Raccoon Creek drains an area of 585 sq miles in Gallia County. The monitoring station at Adamsville shows the river flowing high, 452.3 % above mean flow at 4900 cfs and 16.34 ft deep (flood stage 21ft). (02-07-22)
- Symmes Creek drains 302 sq miles of Lawrence County into the Ohio River; at Aid, the flow is unrated, 290.3% above mean at 2260 cfs and 16.87 ft deep (flood stage 19ft deep). (02-07-22)
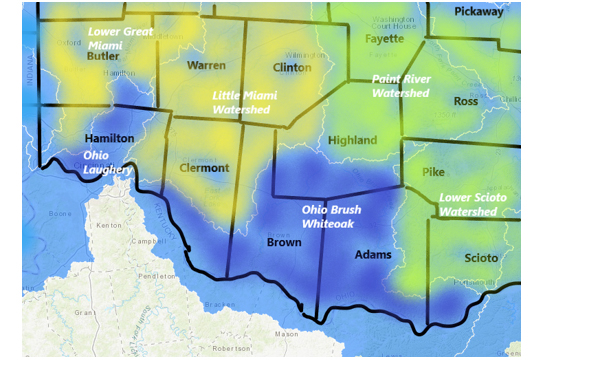
3h Middle Ohio – White Oak Watershed
Flows: we are talking about rainfall and snowmelt off parts of Brown County
- White Oak Creek drains an area of 208 sq miles in Brown County; the flow above Georgetown is 16.3% above mean, 189 cfs and 4.56 ft deep. (02-07-22)
3i Middle Ohio – Laughery Watershed
Flows: rainfall and snowmelt from central Butler and Hamilton Counties
Middle Ohio- Laughery drainage area occupies just over 900 000 acres in Ohio, Kentucky and Indiana. The flow monitoring stations in Ohio are found on Mill Creek.
- Mill Creek drains an area of 115 square miles in Butler and Hamilton Counties. The flow at Evendale is 36.5% above mean at 107 cfs and 5.33 ft deep (flood stage 12ft); at East Sharon Rd in Sharonville the flow is unrated, 3.45 ft deep; at Reading, flow is not ranked, 5.5 ft deep; at Carthage, the flow is 47.2 % above mean at 5.04 cfs and 3.25 ft deep (02-07-22)
- West Fork Mill Creek drains an area of 29.9 sq miles in Hamilton County. The Reservoir near Greenhills is 675.55 ft deep. (updated 02-07-22)
- Sharon Creek drains an area of 5.39 sq miles in Hamilton County. The flow at Sharonville is 1.81 ft deep. (updated 02-07-22)
- Congress Run drains an area of 3.88 sq miles in Hamilton County. The flow near Carthage is unrated and 1.35 ft deep. (updated 02-07-22)
- 
4 Muskingum River Watersheds
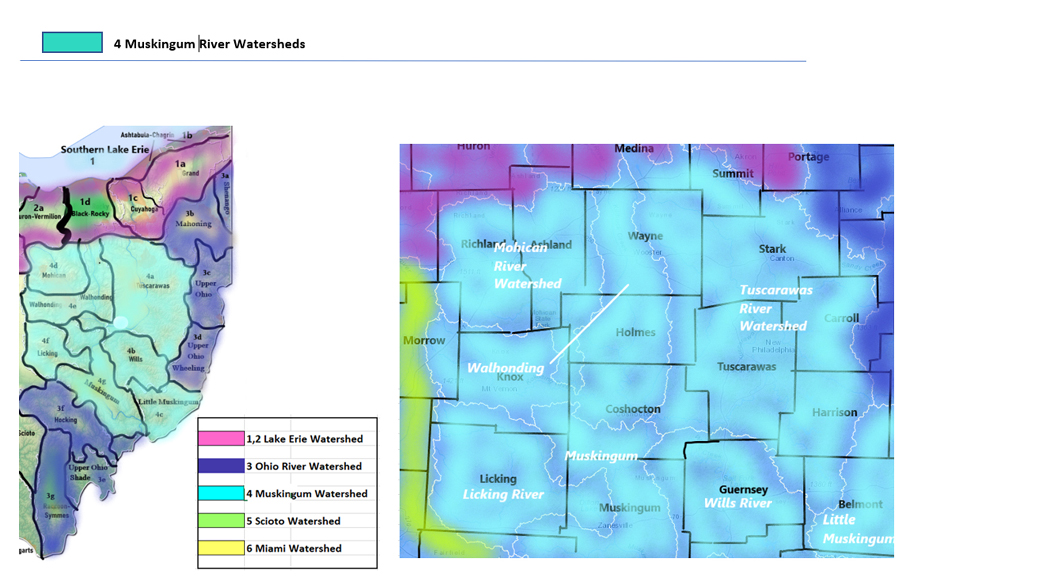
4a Tuscarawas River Watershed
Flows: parts of Tuscarawas County
- Tuscarawas River drains an area of 2443 sq miles of Tuscarawas County before joining the Muskingum River. Flow at Massillon is normal at 106% above mean at 676 cfs and 9.06 ft deep, below Dover Dam near Dover is 6.29 ft deep; at New Philadelphia is not rated, 2800 cfs and 2.93 ft deep (flood stage 7.5 ft) Newcomerstown is normal, 127.4% above mean at 4710 cfs and 4.22 ft deep, (Flood stage 11ft). (02-07-22)
- Chippewa Creek drains an area of 50.4 sq miles in Wayne County. The flow at Miller Rd at Sterling is 69.25% above mean at 78.1 cfs and 2.34 ft deep. (02-07-22)
- Sugar Creek drains an area of 311 sq miles in Tuscarawas County. The flow near Beach City is unrated 2.93 ft deep; at Strasburg is normal, 61.1% above mean at 301 cfs and 3.01 ft deep (updated 02-07-22)
4b Wills Creek Watershed
Flows: parts of Licking, Guernsey, Tuscarawas Counties
- Wills Creek drains an area of 406 sq miles in Guernsey County, making a northward run and looping back down into the Muskingum system. The flow at Derwent is not rated, 6.99 ft deep; at Cambridge is normal, 137.45% above mean at 1150 cfs and 6.76 ft deep (flood stage 15ft); below Will Creek Dam at Wills Creek, flow is not rated, 8.49 ft deep. (02-07-22).
- - Seneca Fork drains an area of 118 sq miles in Guernsey County before joining Wills Creek. The flow below Senecaville Dam near Senecaville is not rated, 2.4% above mean at 6.21 cfs and 4.4 ft deep. (02-07-22)
- Beaver Creek drains an area of17 sq miles in Guernsey County before joining up with Wills Creek. The flow above Senecaville Lake is not rated, 4.97 ft deep, 2.4ºC and 619 µS/cm. (02-07-22)
- Leatherwood Creek drains an area of 69.5 sq miles in Guernsey County. The flow near Kipling is not rated, 91.9% above mean at 161 cfs and 4.19 ft deep. (updated 02-07-22)
4c Little Muskingum River Watershed
Flows: parts of Washington, Noble, Monroe, Guernsey
- Little Muskingum River drains an area of 210 sq miles of Washington County; at Bloomfield is flowing normal range at 11.2% above mean, 45.2 cfs and 3.9 ft deep. (02-01-22)
- Duck Creek drains an area of 260 sq miles in Washington County. The flow below Whipple is 45.8% above mean at 534 cfs and 3.45 ft deep (flood stage 12 ft) East Fork Duck Creek near Harrietsville not rated, 46.9% above mean at 195 cfs and 4.79 ft deep; West Fork Duck Creek at Macksburg is not rated, 41.6% above mean at 143 cfs and 8.15 ft deep (updated 02-07-22)
4d Mohican River Watershed
Flows: catching parts of Richland County
- Clear Fork Mohican River drains an area of 115 sq miles in Richland County. The streamflow gauge at Bellville reports flow of 2.42 ft deep; no volume data available; below Pleasant Hill Dam, 2.26 ft deep; (02-07-22)
- Black Fork Mohican River drains an area of 28 sq miles in Richland County. The flow at Shelby is unrated, 17.2% above mean at 16 cfs and 6.16 ft deep; below Charles Mill Dam near Mifflin is 4.26 ft deep; at Loudonville is 5.52 ft deep (02-07-22)
- Lake Fork drains an area of 271 sq miles in Ashland County. The flow below Mohicanville Dam at Mohicanville is 6.06 ft deep. (updated 02-07-22)
4e Walhonding River Watershed
Flows: parts of Knox, Morrow, Ashland, Richland, Coshocton, Holmes Counties
- Walhonding River drains an area of 1505 sq miles in Coshocton County. the flow below Mohawk Dam at Nellie is unrated, 7.85 ft deep; the flow below Randle is unrated, 3.32 ft deep (02-07-22)
- Kokosing River drains an area of 202 sq miles in Knox County. At Mount Vernon station in Knox County, the Kokosing is flowing normal, 73.9% above mean flow at 227 cfs and 3.3 ft deep (flood stage 14ft) (02-07-22)
- Killbuck Creek drains an area of 464 sq miles in Holmes County. The flow at Killbuck in Holmes County is normal, 109.6% above mean flow at 668 cfs and 10.76 ft deep (Flood Stage 15ft). (02-07-22)
4f Licking River Watershed
Flows: parts of Licking County
- Licking River drains an area of 537 sq miles of Licking County before joining the Muskingum River. The flow monitor at Newark is normal, 26.5% above mean flow at 247 cfs and 3.53 ft deep (flood Stage 14ft), below Dillon Dam near Dillon Falls the flow is unrated, 6.15 ft deep. (02-07-22)
- North Fork Licking River drains an area of 241 sq miles of Licking County; at Utica in Licking County is normal, 43.3% above mean at 80.8 cfs, 7.88 ft deep; at Ohio Street in Newark the flow is not rated, 4.11 feet deep. (02-07-22)
- South Fork Licking River drains an area of 133 sq miles of Licking County. The station at Kirkersville is 23% above historic mean at 29.9 cfs and 4.81 ft deep; near Buckeye Lake flow is unrated, 872.24 ft deep (flood stage 880 ft) Hebron flow is normal, 58.7% above historic mean at 164 cfs and 3.26 ft deep. (02-07-22)
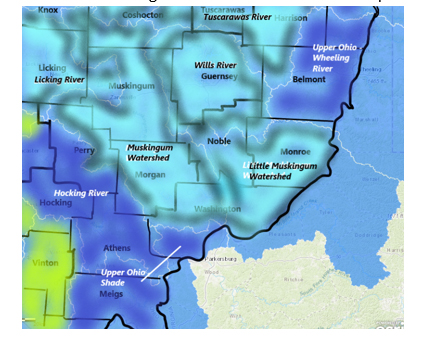
4g Muskingum River Watershed
Flows: Morgan, Washington, Noble, Muskingum, Coshocton Counties
- Muskingum River drains an area of 7947 sq miles. At Coshocton in Coshocton County, the Upper Muskingum is flowing normal, 104.5% at 7840 cfs and 9.89 ft deep (flood stage 15ft); at Dresden in Muskingum County is flowing above normal, 141.2% above mean at 13700 cfs and 12.89 ft deep (flood Stage 20 ft); at Zanesville, unrated, 12.29 ft deep; at McConnelsville in Morgan County, the river is flowing normal, 115.4% above mean at 13500 cfs and 5.84 ft deep (flood stage 11ft). (02-07-22)
- Muskingum River (lower) at Beverly station in Washington County is unrated, 100.7% above mean at 14200 cfs and 19.69 ft deep. (02-07-22)
5 Scioto River Watersheds
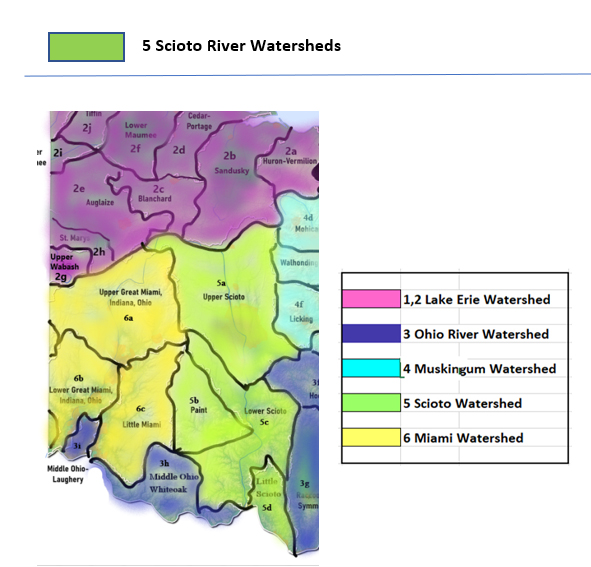
5a Upper Scioto Watershed
Flows: trickling over parts of Madison, Union, Franklin, Pickaway, Champaign, Logan, Marion, Delaware, Morrow, Crawford, Licking, Knox, Fairfield Counties
- The Upper Scioto River drains an area of 980 sq miles in Marion and Delaware Counties. The flow at La Rue in Marion County is normal, 78.9% above mean at 221 cfs, 3.43 ft deep (flood Stage 12ft); the flow at Prospect in Delaware County is normal, 61.4% above mean at 455 cfs and 3.19 ft deep (flood Stage 12ft); the flow below O’Shaughnessy Dam near Dublin is above normal, 120.6% above mean at 1490 cfs, 5.84 ft deep; at 5th Ave Columbus in Franklin County is 33% above mean flow at 924 cfs and 8.54 ft deep; at Columbus flowing normal, 71.2% above mean at 1510 cfs and 7.84 ft deep; near Commercial Point in Pickaway County the flow is 73.65% above mean at 3200 cfs and 12 ft deep. (02-07-22)
- Mill Creek drains an area of 178 sq miles in Delaware County. The flow at Bellepoint is normal, 55.4% above mean at 134 cfs and 2.35 ft deep (update 02-07-22)
- Big Walnut Creek drains an area in Delaware County. The flow at Sunbury is below normal, 25.6% above mean at 50.3 cfs and 5.06 ft deep; flow at Central College is 40.7% above mean at 120 cfs and 3.44 ft deep, (flood stage 11.7 ft); at Rees flow is below normal, 103.3% above mean at 924 cfs and 3.68 ft deep (updated 02-07-22)
- Big Darby Creek drains an area of 534 sq miles in Pickaway County. The streamflow gauge at Darbyville shows normal, flowing at 66.85% above mean at 511 cfs and 3.46 ft deep. (02-07-22)
- Little Darby Creek drains an area of 162 sq miles in Madison County. The flow at West Jefferson is not rated, 77.1% above mean at 215 cfs and 6.45 ft deep. (02-07-22)
- Hellbranch Run drains an area of 35.8 sq miles in Franklin County. The flow at Harrisburg is 41.6% above historic mean at 31.2 cfs and 4.92 ft deep (02-07-22)
- Alum Creek drains an area of 189 sq miles in Delaware County. The flow near Kilbourne is 56.5% above mean at 75.2 cfs and 2.94; at Africa is normal, 134% above mean at 281 cfs and 2.6 feet deep; 1.7ºC at Columbus is not rated, 3.84 ft deep; (02-07-22)
- Upper Olentangy River drains an area of 157 sq miles in Marion County, 393 sq miles by the time it reaches Delaware. The flow at Claridon in Marion County is 3.35 ft deep; the flow at Delaware in Delaware County is normal, 52.45% above mean at 232 cfs and 2.43 ft deep (flood Stage 9ft); near Worthington is normal, 48.1% above the mean, 265 cfs and 2.4 ft deep. (02-07-22)
- Whetsone Creek drains an area of 37.9 sq miles in Morrow County. The flow at Mt. Gilead is 28.5% above mean at 24.1 cfs and 2.67 ft deep (flood stage 9 ft) (update 02-07-22)
- 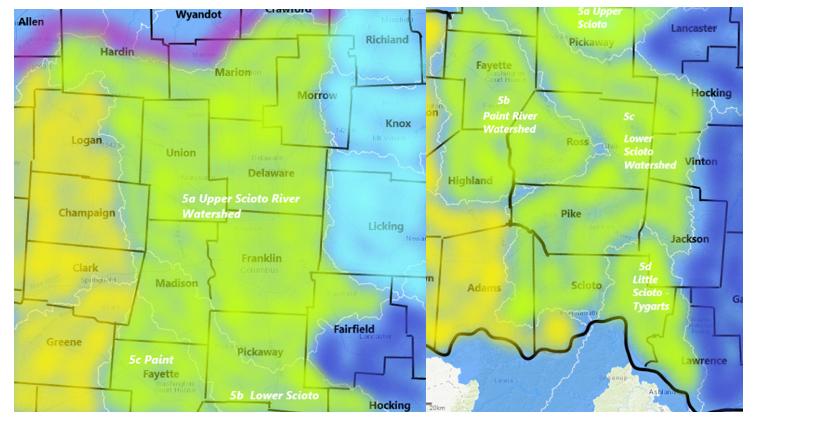
5b Paint Creek Watershed
Flows: parts of Clinton County
- Paint Creek drains an area of 249 sq miles in Clinton and Ross Counties. The flow at Greenfield is below normal, 27.4% above mean, 137 cfs and 2.45 ft deep; near Bainbridge is not rated, 3.37 ft deep, .2ºC; near Bourneville is normal, 71.1% above mean at 1050 and 3.65 ft deep; at Chillicothe, the flow is normal at 50% above historic mean at 1540 cfs and 7.5 ft deep. (02-07-22)
5c Lower Scioto Watershed
Flows: Parts of Madison, Highland, Franklin counties
- Scioto River (lower) drains an area of 5836 sq miles from its headwaters in Marion County down to its outlet at the Ohio River. The lower end flow at Circleville in Pickaway County is not rated, 98% above mean at 4810 cfs and 5.09 ft deep; at Chillicothe in Ross County, flow is normal at 90.7% above historic mean at 5200 cfs and 5.16 ft deep; at Higby in Ross County is normal, 89.8% above mean flow at 7050 cfs and 4.77 ft deep; the flow at Piketon in Pike County is not rated, 83.8% above mean, 10100 cfs, and 7.74 ft deep. (02-07-22)
- Deer Creek drains an area of 228 sq miles in Madison County. The flow at Mount Sterling is normal, 40.6% above mean at 171 cfs and 4.5 ft deep; flow at Pancoastburg is not rated, 1.57 ft deep; at Williamsport the flow is not rated, 3.76 ft deep (02-07-22)
- Rattlesnake Creek drains an area of 209 sq miles in Highland County. The flow at Centrefield is 2.26 ft deep. (updated 02-07-22)
- Rocky Fork Creek drains an area of 140 sq miles in Highland County. The flow at Barretts Mills is below normal, 85.2% above mean at 257 cfs and 3.15 ft deep. (02-07-22)
- Walnut Creek drains an area of 274 sq miles. The flow at Ashville is 28% above mean, 217 cfs and 5.8 ft deep. (02-07-22)
5d Little Scioto Watershed
- Tygart’s Creek drains 242 sq miles in Greenup County. The flow near Greenup, KY is normal, 98% above the mean, 628 cfs and 4.72 ft deep. (02-07-22)
6 Miami River Watersheds - flow
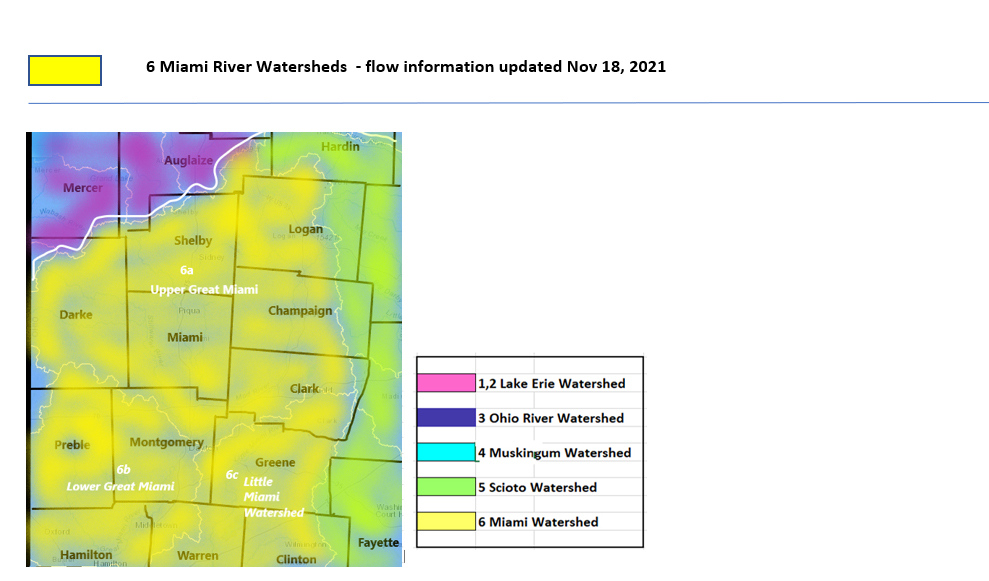
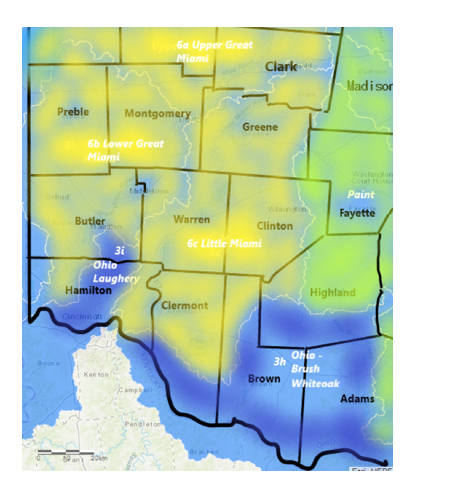
6a Upper Great Miami Watershed
- The Great Miami River (Upper) drains an area of 1149 sq miles in Hardin, Logan, Shelby, Miami and Darke, and Montgomery Counties. The flow monitoring station closest to the head of the river is at Sidney, in Shelby County. The flow at Sidney is normal, 56.9% above mean at 395 cfs and 2.16 ft deep (flood stage 10ft); at Piqua flow is 25.1% over mean at 542 cfs and 2.07 ft deep (flood stage is 14 ft); at Troy is above normal, 45.8% above the mean at 630 cfs and 2.93 ft deep; the flow at Taylorsville is normal, 61.8% above mean at 942 cfs and 3.33 ft deep (flood stage 22 ft) (updated 02-07-22)
- Loramie Creek drains an area of 257 sq miles in Shelby County. The flow near Newport is normal, 9.25% above mean, 21.5 cfs and 3.69 ft deep; at Lockington in Shelby County is normal, 37.2% above mean, 127 cfs and 1.52 ft deep. (updated 02-07-22)
- Bokengehalas Creek drains an area of 40.4 sq miles of Logan County. The station at de Graff is not rated, 46.9% above mean flow at 42 cfs and 1.68 ft deep; (updated 02-07-22)
- Mad River drains a combined area of 635 sq miles in Clark, Champaign, Greene, and Logan Counties. The upper portion of the river is monitored from a station at West Liberty, flow is normal, 58.95% above mean, 39.8 cfs and 2.65 feet deep; the flow near Urbana is above normal, 95.6% above mean at 180 cfs and 3.25 ft deep; St. Paris Pike is normal, 77% above mean, 348 cfs and 6.61 ft deep; at Springfield is normal, 73.5% above mean at 550 cfs and 1.57 ft deep (flood stage 8ft); the flow near Dayton is normal, 77.4% above mean, 779 cfs and 3.41 ft deep (flood stage 25ft) (updated 02-07-22)
- Stillwater River drains an area of 503 sq miles in Miami County. The flow at Pleasant Hill is normal, 40.5% above the mean, 268 cfs and 2.04 ft deep, .5°C; at Englewood is flowing above normal, 40.5% above mean at 443 cfs and 3.66 ft deep (flood stage 58 ft) (02-07-22)
- Greenville Creek drains an area of 193 sq miles in Warren and Darke Counties. The flow near Bradford is normal, 78.9% above mean, 205 cfs and 2.21 ft deep. (updated 02-07-22)
6b Lower Great Miami Watersheds
- Great Miami River drains an area of 3838 sq miles in Ohio, with the lower portion taking runoff from sq miles in Hamilton and Butler Counties. At Dayton flow is normal, 57.1% above mean at 2320 cfs and 25.85 ft deep (flood stage 41ft); at Miamisburg, Montgomery County flow is normal, 84.3% above mean at 2760 cfs and 5.43 ft deep (flood stage 16ft); at Franklin the flow is 44.1% above mean at 2890 cfs and 2.48 ft deep (flood stage 14 ft); at Middletown flow is 47.95% above mean at 3230 cfs and 3.36 ft deep (flood stage 12 ft) 3.9°; at Hamilton flow is above normal, 79.1% above mean at 3880 cfs and 63.96 feet deep (flood stage 75ft); at Miamitown the flow is 3.32 ft deep (flood stage 16ft) (updated 02-07-22)
- Wolf Creek drains an area of 68.7 sq miles in Montgomery County into the Great Miami River. The flow at Dayton is normal, 45% above mean flow at 42.1 cfs and 1.54 ft deep (updated 02-07-22)
- Holes Creek drains an area of 18.7 sq miles in Montgomery County into the Great Miami River. The flow near Kettering is normal, 59.6% above mean at 18.9 cfs and 2.69 ft deep. (updated 02-07-22)
- Twin Creek drains an area of 275 sq miles of Montgomery County into the Great Miami River. The flow near Germantown is normal, 39% above mean at 176 cfs and 1.97 ft deep (flood stage 62 ft). (updated 02-07-22)
- Sevenmile Creek drains 69 sq miles of Preble County into the Great Miami River. The flow at Camden is below normal, 18.1% above mean at 20.3 cfs and 3.45 ft deep. (updated 02-07-22)
6c Little Miami Watershed
- Little Miami River drains an area of 1203 sq miles in Clark and Greene Counties. The flow near Oldtown is normal, 56.8% above mean at 104 cfs and 1.93 ft deep, 0.8°C; near Spring Valley is 3.54 ft deep (flood stage 11ft); at Milford is normal, 81.2% above mean, 1570 cfs, and 6.55 ft deep (flood stage 17ft) (updated 02-07-22)
- East Fork Little Miami River drains an area of 476 sq miles in Clermont County. Flow at Williamsburg is normal, 19.2% above mean at 98.9 cfs and 1.46 ft deep; below Harsha Dam near Bantam in Clermont County is 16.31 ft deep, water temperature is 3.7°C, the flow at Perintown is below normal, 18.65% above mean at 202 cfs and 2.82 ft deep (flood stage 19ft) (updated 02-07-22)
- Massies Creek drains an area of 63.2 sq miles in Greene County into the Little Miami River. The flow at Wilberforce is 41.5% above mean at 42.7 cfs and 2.58 ft deep (updated 02-07-22)
- Caesar Creek drains an area of 239 sq miles in Warren County into the Little Miami River. The flow near Wellman is 6.46 ft deep and 6.4°C (updated 02-07-22)
- O’Bannon Creek drains an area of 54 sq miles in Clermont County. The flow at Loveland is normal, 16.7% above mean flow, 25.4 cfs and 1.32 ft deep; (updated 02-07-22)
Report Key
Ohio EPA Drinking Water Watch
Public Drinking Water Source SW – Surface Water is drawn from lake, reservoir, creek or river; GW – Groundwater is drawn from a well
Violations and Enforcement Actions are shown for the current year
Lead and Copper Test results are shown for the current year if available
Water systems are classified according to rules developed by the U.S. Environmental Protection Agency (EPA) and each state. Water Systems fall into two broad categories: public and non-public.
Public water systems are classified as one of the following:
|
C – Community
|
Serves at least 15 service connections used by year-round residents or regularly serves 25 year-round residents.
|
|
NTNC – Non-Transient Non-Community
|
Serves at least the same 25 non-residential individuals during 6 months of the year.
|
|
NC – Transient Non-Community
|
Regularly serves at least 25 non-residential individuals (transient) during 60 or more days per year.
|
This classification is based on information in each of the following five areas:
|
1.
|
Quantity and type of population served (e.g., transient, residential).
|
|
2.
|
Number of days served (or annual operating period (i.e., the period(s) of the year that the water system is in operation)).
|
|
3.
|
Number of service connections (i.e., the number of connections for each service area such as commercial, agricultural, residential).
|
|
4.
|
Activity status of the water system (i.e., active, or inactive).
|
|
5.
|
Sources of water (e.g., reservoir, well. Sources of water may be active or inactive depending on whether the source is seasonal or year-round. The current date determines active or inactive status).
|
|
|
|
|
|
|
Bottom of Form
USGS Provisional Data Statement
Data are provisional and subject to revision until they have been thoroughly reviewed and received final approval.
Current condition data relayed by satellite or other telemetry are automatically screened to not display improbable values until they can be verified.
Provisional data may be inaccurate due to instrument malfunctions or physical changes at the measurement site. Subsequent review based on field inspections and measurements may result in significant revisions to the data.
Data users are cautioned to consider carefully the provisional nature of the information before using it for decisions that concern personal or public safety or the conduct of business that involves substantial monetary or operational consequences.
Information concerning the accuracy and appropriate uses of these data or concerning other hydrologic data may be obtained from the USGS.


