|

|
|
 
6a Upper Great Miami Watershed Flows in the north end of the watershed take the runoff from parts of Hardin, Logan, Shelby, Miami, Darke, Clark and Montgomery Counties Great Miami River (Upper) drains an area of 1149 sq miles in Hardin, Logan, Shelby, Miami and Darke and Montgomery Counties. The flow monitoring station closest to the head of the river is at Sidney, in Shelby County.
Loramie Creek drains an area of 257 sq miles in Shelby County. The flow
Bokengehalas Creek drains an area of 40.4 sq miles of Logan County. The station at de Graff is not rated, we see this around 30 cfs and 1.5 ft deep Mad River drains a combined area of 635 sq miles in Clark, Champaign, Greene and Logan Counties. Flow Greenville Creek drains an area of 193 sq miles in Warren and Darke Counties. Normal flow near Bradford is 90 cfs and 1.8 ft deep. Stillwater River drains an area of 503 sq miles in Miami County. The flow Flows (2 low) June 12 11:00 am EDT Great Miami River is flowing HABs (0) Public Drinking Water Advisories (3) confirmed ongoing as of June 12, 2023 Liberty Baptist Temple PWS, Springfield (Clark) Boil Water Advisory issued by Ohio EPA Microbiological contamination – e.coli Boil the water before using or use bottled water MCL = confirmed presence of e.coli This is a non-community system serving less than 250 persons from groundwater source Voyager Village Mobile Home Park, Dayton (Montgomery) Sensitive Population Advisory issued by Ohio EPA Exceeds standard for inorganic chemical - fluoride MCL = 4 mg/l and Secondary MCL = 2 mg/l Children under nine should be provided with alternative sources of drinking water or water that has been treated to remove fluoride in order to lessen the risk of cosmetic discoloration of their permanent teeth This is a community system serving less than 250 persons from groundwater source. Village of South Vienna PWS (Clark) Sensitive Population Advisory issued by Ohio EPA Exceeds standards for inorganic chemical – arsenic MCL = 10 ug/l You do not need to use an alternative (e.g. bottled) water supply. If you have specific health concerns, consult your doctor Source - erosion of natural deposits; Runoff from orchards; Runoff from glass and electronics production wastes This is a community system serving between 251 and 1000 persons from groundwater source Spills (2)
6b Lower Great Miami Watershed Flows in this southern half of the Great Miami drainage basin collect runoff from 1400 square miles of Hamilton, Montgomery, Preble and Butler Counties Great Miami River drains a area of 3838 sq miles in Ohio, with the lower portion taking runoff from 1400 sq miles in Hamilton and Butler Counties. Holes Creek drains an area of 18.7 sq miles in Montgomery County into the Great Miami River. The flow near Kettering is unrated, around 5 cfs and 2.5 ft deep Twin Creek drains an area of 275 sq miles of Montgomery County into the Great Miami River. Normal flow near Germantown is around 120 cfs 1.8 ft deep (flood stage 62 ft). Sevenmile Creek drains 69 sq miles of Preble County into the Great Miami River. Normal flow at Camden is 40 cfs and 3 ft deep. Flows (0 low) HABs (0) Public Drinking Water Advisories (0) Spills (1)
6c Little Miami River Watershed Flows in this watershed gather surface water runoff from Clark, Clermont, Warren and Greene Counties 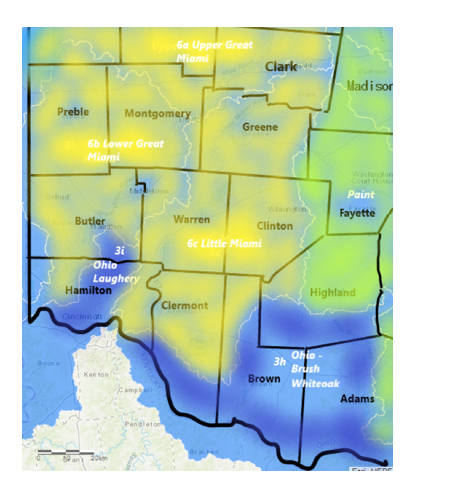 Little Miami River drains an area of 1203 sq miles in Clark and Greene Counties. The flow East Fork Little Miami River drains an area of 476 sq miles in Clermont County. Flow Massies Creek drains an area of 63.2 sq miles in Greene County into the Little Miami River. When the flow monitoring station at Wilberforce is normal, we see values of 60 cfs and 3 ft deep. Caesar Creek drains an area of 239 sq miles in Warren County into the Little Miami River. The flow near Wellman is unrated, 6.8 ft deep, temperature is monitored here O’Bannon Creek drains an area of 54 sq miles in Clermont County. The flow at Loveland is unrated, we see it around 20 cfs and 1.3 ft deep when conditions upstream are normal Flows (0 low) HABs (0) Public Drinking Water Advisories (0) Spills (4) Report Key With the Flow Ohio tracks trends in your watershed, posting updates from USGS WaterWatch Current Streamflow and Ohio EPA Division of Drinking and Ground Waters, Ohio Beachguard (seasonally). Flows: With The Flow describes Ohio’s rivers and tributaries from headwaters to outlet. Locate your “home body” (the river or stream nearest you) to see where the flow originates, how high it has to be for minor flooding to occur. Log in to USGS Waterwatch current streamflow for real time measurements at the monitoring station nearest you and sign up there for high flow alerts. Flow volume can change rapidly during snowmelt and rain events. Streamflow data is subject to review as sensors at the monitoring stations do malfunction from time to time. Refer to USGS Provisional Date Statement for more information. Public Drinking Water Advisories The Safe Drinking Water Act (SDWA) is federal law that safeguards the public drinking water supply. SDWA requires drinking water facilities (DWF) in every state follow national quality standards, monitor, record and report on water quality with quarterly inspections. EPA provides public access to the inspection reports, violations and enforcement actions on all registered DWFs in the USA. Annual water quality reports are required from every DWF, available from the facility, describing the treatment process and source water. DWFs are categorized as follows: - community system serves the same people year round - Non-transient, Non-Community – supplies water to at least 25 of the same people at least six months of the year - Transient, Non-Community – supplies water to intermittent users, temporarily at the location eg. Gas stations, campgrounds Note from Ohio EPA: “Boil advisories that are on record with Ohio EPA often are related to exceedances of E.coli maximum contaminant levels (MCL) at public water systems, or other major events. Staff in Ohio EPA’s district offices update (public drinking water) advisories at least monthly. Many of the advisories are based on sampling results that occur monthly, quarterly, semi-annually, or less frequently, depending on the requirements of state and federal drinking water regulations. All advisories, including those involving more immediate health risks such as boil advisories, are required to be communicated directly to consumers by the individual public water systems. When a boil advisory is not required by rule, a public water system will issue a precautionary boil advisory and the public water system would not be required to submit it to Ohio EPA. Ohio EPA does not have a record of all (or even most) boil advisories for Ohio public water systems.” (Dina Pierce, spokesperson for Ohio EPA) Hazardous Spills Spills, fish kills, rainbow sheen and releases of contaminants in the state of Ohio are reported here by watershed, as per the data source, the Ohio Environmental Protection Agency, Office of Environmental Response. Users of this data should be aware that inconsistencies and inaccuracies may exist if these data are compared to data from other time periods due to changes in methods of data collection and mapping. This report includes spills reported to the Ohio EPA as follows: - 40 gallons or more of petroleum product - toxic chemical materials, corrosives spills of any amount - all reports impacting water bodies Spills marked with asterisk are followed up with Ohio EPA authorities for additional information on the clean-up and recovery, including notices of violation and charges under State environmental statutes, federal charges under the Clean Water Act. See Ohio CrimeBox for more information on criminal prosecutions under the CWA. --#include virtual="/includes/wtoh-disclaimer-end.inc"--> |